
Logarithmic Function by Folens Publishers
Loading the math board and drawing, please wait…
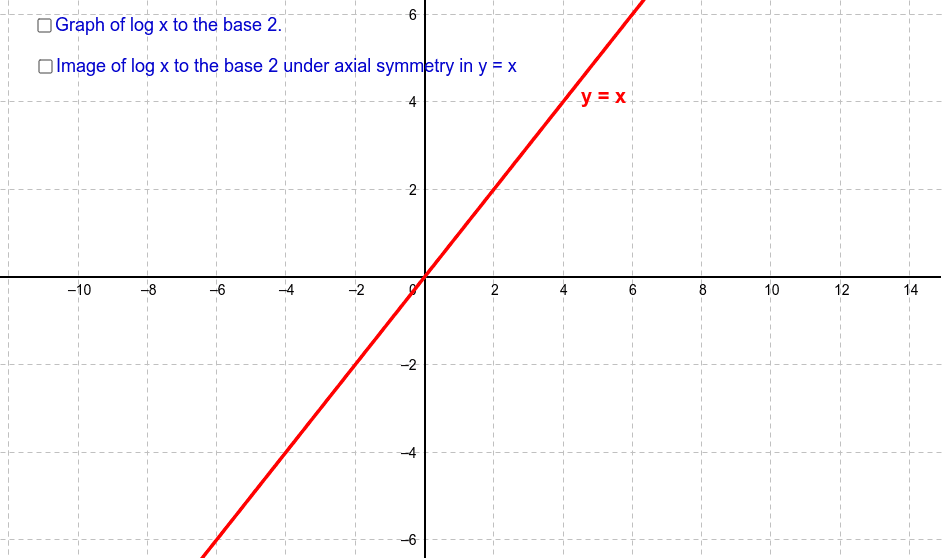
This example demonstrates the graph and properties of a logarithmic function. Key mathematical concepts include logarithmic functions, function graphs, and their basic properties. By plotting the logarithmic function f(x) = log_a(x) and its inverse g(x) = a^x, and using GeoGebra commands such as `f, A, B, C, E, D, G, H, I, J, K, a, b`, the characteristics and properties of the logarithmic function are illustrated. Suitable for high school mathematics education and learning.
GeoGebra Commands & Parameters
f(x) = ld(x)(0.5, f(0.5))(1, f(1))(2, f(2))(4, f(4))(8, f(8))(16, f(16))g(x) = xh(x) = 2^(x)(-4, h(-4))(-2, h(-2))(0, h(0))(1, h(1))(2, h(2))Boolean a(false)Boolean b(false)
AI Drawing Prompt Reference
Plot the logarithmic function f(x) = log(x) and its inverse g(x) = 2^x. First, plot f(x) = log(x) and mark points (0.5, 1, 2, 4, 8, 16) on the x-axis, then connect these points. Next, plot g(x) = 2^x and mark points (-4, -2, 0, 1, 2) on the x-axis, then connect these points.
The prompt above was compiled from the original drawing commands and is for reference only.