
Symbolic Language of Monotonicity for Quadratic Functions
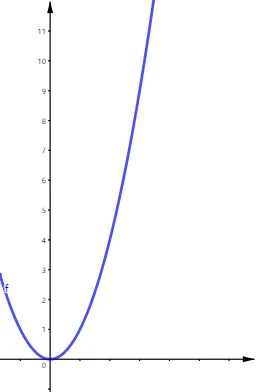
This GeoGebra example demonstrates the monotonicity (increasing or decreasing) of quadratic functions on specified intervals. Users can dynamically adjust parameters a, b, and c via input boxes to observe real-time changes in the function graph, while the symbolic definition of monotonicity is displayed using formal mathematical notation. Core mathematical concepts include: the ε-δ language or interval definition of function monotonicity, characteristics of quadratic function graphs (opening direction, axis of symmetry), and the relationship between derivatives and monotonicity. Construction highlights: InputBox commands accept parameter values, the function f(x)=ax²+bx+c generates dynamic parabola graphics, Textfield displays symbolic monotonicity definitions (e.g., ∀x₁<x₂∈[m,n], f(x₁)<f(x₂)), and Segment commands create auxiliary lines for visual assistance. Suitable for high school mathematics 'Function Monotonicity' lessons or review sessions, as well as introductory calculus courses, helping students bridge intuitive graphical understanding with rigorous symbolic definitions.
Loading the math board and drawing, please wait…