
Quadratic Function Extremum Discussion: Geometric Intersection for Optimization
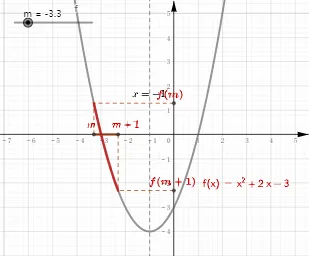
This example demonstrates a visually driven approach to quadratic function extremum problems by linking the best value to geometric intersection points between relevant curves and auxiliary lines/equations. It highlights how extremum information can be inferred from where the graphs (or their corresponding algebraic constraints) meet. Key mathematical concepts include quadratic function extrema (vertex-based reasoning), interpreting solutions of equation systems via intersections, and using analytic expressions as constraints to guide optimization-style discussion. In construction, GeoGebra commands center on Segment to build the essential geometric segments, Intersect to compute the intersection points that encode solution candidates, and LaTeX to typeset and display the involved functions and equations (such as f, eq1–eq3, g, h). The scene includes functions/relations (f, g, h), multiple equation objects (eq1, eq2, eq3), auxiliary points/parameters (e.g., m, i–l, A–D), and text labels (text1–text6) to connect the “extremum condition → intersection → conclusion” workflow. Suitable for high-school learners studying functions and optimization, as well as classroom exploration and contest-prep visualization.
Loading the math board and drawing, please wait…