
Geometric link between hyperbola and statistics: variance, standard deviation &
Loading the math board and drawing, please wait…
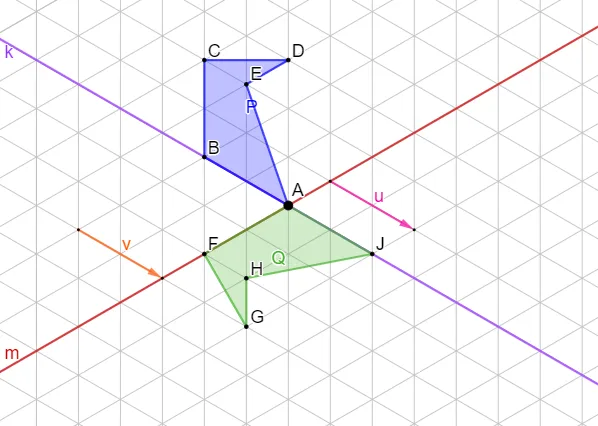
This GeoGebra example demonstrates a geometry-based visualization that connects hyperbola-related structure with probability & statistics concepts such as variance, standard deviation, and the median line. The key mathematical ideas are the measurement of spread via variance/standard deviation, the geometric intuition behind the median line (center/typical position), and how a hyperbola’s geometric constraints can be incorporated into a single interactive diagram. Construction-wise, it is built using GeoGebra’s fundamental tools: Polygon to form multi-vertex scaffolding, Line to define straight geometric relations, Point to place and reference key positions, and Vector to encode directional or magnitude information. The construction summary indicates many auxiliary points (e.g., A, B, C, D, E, P, and labeled helper objects such as a, b, c, d, e, F, G, H, J, Q), reflecting a typical workflow of assembling a structured figure from multiple defining points and lines, then overlaying the hyperbola/geometry component with the statistical interpretation. Suitable for advanced middle school, high school, or early college learners for classroom demonstration, homework review, and interdisciplinary practice between analytic geometry and probability & statistics.
GeoGebra Commands & Parameters
Polygon(A, B, C, D, E) → P, a, b, c, d, ePolygon(A, F, G, H, J) → Q, a_1, f, g, h, iLine(F, A) → mLine(B, A) → kPoint(m) → IVector(I, K) → uVector(L, M) → v
AI Drawing Prompt Reference
On the same canvas, build a geometry-linked diagram intended to connect statistical ideas with a hyperbola-related structure: first draw a polygonal frame by connecting several key points into one multi-vertex polygon, then add a second multi-vertex polygon from another set of points as an auxiliary scaffold. Next, draw two straight lines that emanate from a common reference point toward two different endpoints. Choose a point on one of these lines to serve as a geometric reference, then draw a vector (arrow) from that reference point toward another given point to encode direction and magnitude. Add a second vector elsewhere to reflect the corresponding directional relationship. Keep the layout consistent with an interactive geometry setup for later interpretation in probability and statistics.
The prompt above was compiled from the original drawing commands and is for reference only.