
Decimal Dials
Loading the math board and drawing, please wait…
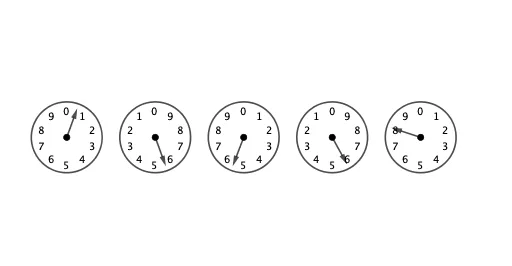
This example visualizes decimals using an energy meter, covering core math concepts like decimals, coordinate systems, vectors, and parametric equations. It is constructed using GeoGebra commands like Circle, Vector, and Sequence, making it suitable for middle school students and beyond to learn decimals, vectors, and parametric equations, or for educational demonstrations.
GeoGebra Commands & Parameters
Circle(B, 0.4) → cCircle(C, 0.4) → dCircle(D, 0.4) → eCircle(E, 0.4) → fCircle(F, 0.4) → gVector(B, A) → uVector(C, G) → vVector(D, H) → wVector(E, I) → aVector(F, J) → bSequence(Sequence[Text[n, (m + (((-1)^(m) * 0.3) * cos((((2 * π) * n)) / 10 + π / 2)) - 0.04, (((-1)^(m) * 0.3) * sin((((2 * π) * n)) / 10 + ((-1)^(m) * π / 2))) - 0.05)], n, 0, 9], m, 1, 5) → l1
AI Drawing Prompt Reference
Draw an energy meter to visualize decimals, including multiple concentric circles and a central point, with vectors radiating outward from the center connecting to each circle, spaced evenly, forming a gauge-like shape with decimal labels at each position.
The prompt above was compiled from the original drawing commands and is for reference only.