
Data Table Probability: Basic
Loading the math board and drawing, please wait…
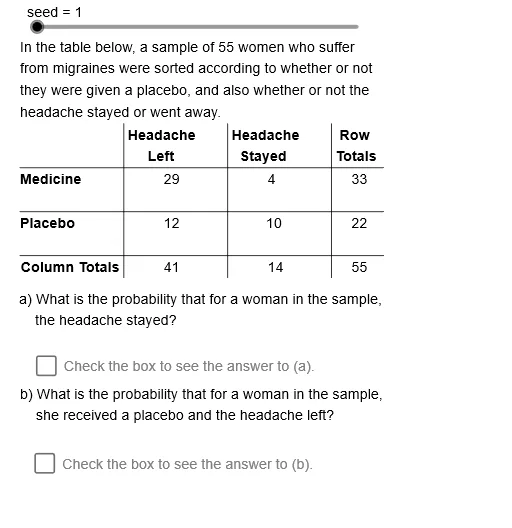
This example demonstrates how to calculate probability using data tables and combines it with geometric figures. Key mathematical concepts include probability, geometric construction, and data analysis. Construction involves using GeoGebra commands like Element, Min, Sum, and objects such as Prb11Sq. Suitable for middle or high school mathematics to understand the connection between probability and geometry.
GeoGebra Commands & Parameters
Element(Prb11Sq, DataSet) → Prb11Element(Prb21Sq, DataSet) → Prb21Element(Prb22Sq, DataSet) → Prb22Element(Prb12Sq, DataSet) → Prb12Min({Prb11, Prb12, Prb21, Prb22}) → PrbMnElement(TbClRwSq, Ch03) → CRMtrxElement(CRMtrx, Ch05) → CoRCNSqElement(CoRCNSq, Ch07) → CoRChNmSum(CoRCNSq) → CNSSmElement(CRMtrx, Ch06) → CoRNCSqElement(CoRNCSq, Ch07) → CoRNCNmElement(Cl2OpSq, DataSet) → Cl2TxElement(Cl1OpSq, DataSet) → Cl1TxElement(Rw2OpSq, DataSet) → Rw2TxElement(Rw1OpSq, DataSet) → Rw1TxElement(DDSq, DataSet) → DD0Element(RL1Sq, DataSet) → RL1Element(RL2Sq, DataSet) → RL2Element(CL1Sq, DataSet) → CL1Element(CL2Sq, DataSet) → CL2Segment((TbLf, TbTp - TbCH), (TbLf + (3.5 * TbCW), TbTp - TbCH)) → htpSegment((TbLf, TbTp - (2 * TbCH)), (TbLf + (3.5 * TbCW), TbTp - (2 * TbCH))) → hmdSegment((TbLf, TbTp - (3 * TbCH)), (TbLf + (3.5 * TbCW), TbTp - (3 * TbCH))) → hbtSegment((TbCW, TbTp), (TbCW, TbTp - (3.5 * TbCH))) → vlfSegment(((2 * TbCW), TbTp), ((2 * TbCW), TbTp - (3.5 * TbCH))) → vmdSegment(((3 * TbCW), TbTp), ((3 * TbCW), TbTp - (3.5 * TbCH))) → vrgElement(IndSq, DataSet) → IndElement(Rw1OpSq, DataSet) → Op1TxElement(Rw2OpSq, DataSet) → Op2TxElement(Cl1OpSq, DataSet) → Op3TxElement(Cl2OpSq, DataSet) → Op4TxElement(ClOpSq, Ch05) → ChTxElement(TbCROpSq, Ch03) → CoROpChElement(CoROpCh, Ch05) → OpCh1Element(TbCROpSq, Ch04) → CoROpNCElement(CoROpNC, Ch07) → OpNCElement(IDArtSq, DataSet) → IDArtElement(CoRCNSq, 1) → CN1Element(CoRCNSq, 2) → CN2Element(TbCRNmbSq, Ch03) → CRNmbChElement(CRNmbCh, Ch05) → PrtANmElement(RwOpSq, Ch05) → OpCh2Element(ClOpSq, Ch07) → OpCh3Element(TbRwSq, Ch05) → ChRwElement(ChRw, Ch07) → ChNmbIf(DataSet ≟ 3 ∧ DataSet ≟ 6, " ", ",") → Cm
AI Drawing Prompt Reference
Create a data table for probability calculation, integrated with geometric figures. The table consists of horizontal and vertical line segments forming a grid, with probability values extracted from datasets, such as probabilities of different events. Start by defining the probability data, then draw the table structure with segments for rows and columns, and finally add text labels in cells to identify the data. The figure should clearly show the connection between probability and geometry.
The prompt above was compiled from the original drawing commands and is for reference only.