
Sample Size for a Population Mean (Geometric Visualization)
Loading the math board and drawing, please wait…
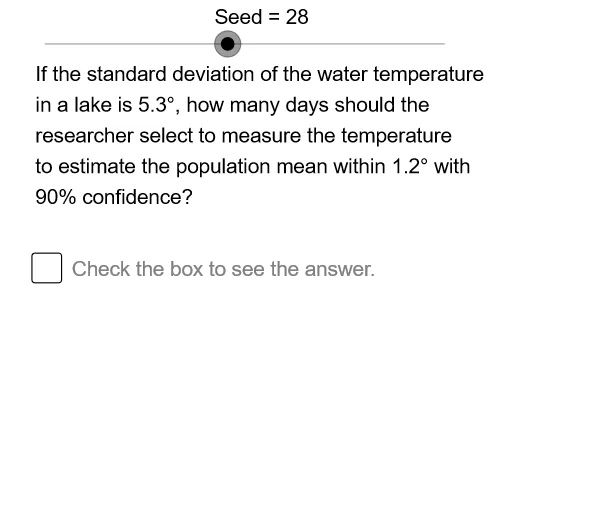
This example demonstrates, via interactive geometric construction, how to determine the required sample size for estimating a population mean given a confidence level and a target margin of error (precision). It focuses on the logic behind confidence intervals: the relation between sampling variability, the confidence factor, the standard error, and the resulting error bound. Core concepts include population-mean estimation, confidence-driven scaling, and the dependence of margin of error on sample size (capturing the inverse/functional relationship). In GeoGebra, the workflow is translated into dynamic objects using Element, Sequence, If, Segment, and CircumcircleArc: Element and Sequence generate and update key computational/graphical entities; If implements conditional choices (e.g., selecting the appropriate confidence-related quantity); Segment provides measurable error/interval lengths; and CircumcircleArc helps visualize confidence-linked curvature/arc measures. Intermediate variables such as squared terms and multiplications (e.g., SDSq, CnfSq, FcSq, MltSq, OESq, Conf, Err) are combined to link statistical calculations with geometric heights and derived measures (e.g., Ht1/Ht2, Sp1/Sp2, Crv1/Crv2). Suitable for high school to early undergraduate probability & statistics, especially for teaching how confidence level and allowable error translate into sample-size requirements using an interactive model.
GeoGebra Commands & Parameters
Element(SDSq, Op0) → SDElement(MltSq, Op0) → MltElement(OESq, Op0) → OESequence(Mod[7 + (29 * k), 60] + 1, k, 1, 60) → OpSq, {37, 6, 35, 4, 33, 2, 31, 60, 29, 58, 27, 56, 25, 54, 23, 52, 21, 50, 19, 48, 17, 46, 15, 44, 13, 42, 11, 40, 9, 38, 7, 36, 5, 34, 3, 32, 1, 30, 59, 28, 57, 26, 55, 24, 53, 22, 51, 20, 49, 18, 47, 16, 45, 14, 43, 12, 41, 10, 39, 8}Element(OpSq, Seed) → OpNm1Element(CnfSq, Op1) → ConfElement(FcSq, Op2) → FacIf(Err ≟ 1, "", "s") → PlTxIf(Err ≟ 1, " book", " books") → BKSegment(LE1, RE1) → dvbr1CircumcircleArc(LT1, LC1, LB1) → LfPr1CircumcircleArc(RT1, RC1, RB1) → RtPr1Segment(RE2, LE2) → dvbr2CircumcircleArc(LT2, LC2, LB2) → LfPr2CircumcircleArc(RT2, RC2, RB2) → RtPr2Element(DDSq, Op0) → DD0
AI Drawing Prompt Reference
This is a geometric construction showing sample size calculation. The graph includes a dynamic circle and two arcs representing confidence intervals. The circle's radius relates to sample size, and the arc lengths represent error ranges. Users can adjust confidence level and error target via a slider, and the circle and arcs update accordingly. The construction order starts with the circle, then adds arcs, and finally controls changes through the slider. The graph visually demonstrates the relationship between sample size and error, suitable for teaching probability and statistics concepts.
The prompt above was compiled from the original drawing commands and is for reference only.