
Random Data: Minimum, Maximum & Range Statistics
Loading the math board and drawing, please wait…
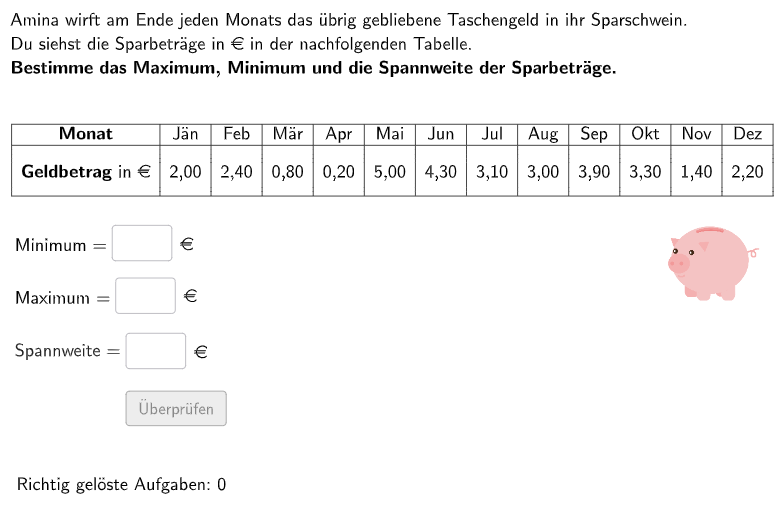
This GeoGebra lesson demonstrates how to compute and interpret the minimum, maximum, and range (max − min) from a randomly generated data set. The key math ideas are probability & statistics concepts: handling data lists, determining min/max values, and understanding range as a measure of spread. Construction highlights include: using Shuffle to randomize the month-based data, Min and Max to extract minimum and maximum from the list, and range to calculate the spread; employing Textfield for student inputs and comparing them against correct1/correct2/correct3; building and managing graphical elements with Polygon, Append, Remove, Element, First, Last, and ensuring variables are Defined; using IsInteger to enforce integer constraints on generated or entered values. Colored objects (Blue/Green/Orange/Red/Purple) support visual differentiation of steps or elements. Suitable for grades 5–6 and classroom practice on data handling and statistical characteristic interpretation.
GeoGebra Commands & Parameters
Shuffle(Sequence[Random[0, 50], i, 1, 100]) → random12Monat, {8, 22, 28, 25, 43, 11, 19, 40, 25, 41, 37, 7, 8, 8, 32, 21, 48, 24, 43, 24, 22, 27, 45, 40, 10, 32, 34, 9, 9, 19, 14, 9, 5, 11, 44, 21, 26, 46, 3, 31, 47, 4, 27, 19, 21, 19, 20, 50, 23, 5, 13, 8, 32, 9, 10, 40, 0, 32, 1, 5, 46, 23, 46, 36, 0, 25, 30, 4, 50, 19, 14, 43, 5, 9, 47, 42, 40, 50, 31, 15, 33, 22, 5, 12, 32, 42, 48, 36, 0, 48, 5, 28, 33, 9, 34, 33, 31, 6, 11, 27}Shuffle(Sequence[Random[0, 50], i, 1, 100]) → random11Monat, {45, 14, 46, 28, 38, 49, 47, 26, 5, 16, 25, 22, 20, 19, 17, 46, 28, 15, 16, 33, 40, 1, 3, 19, 47, 11, 41, 29, 12, 8, 13, 40, 19, 49, 15, 45, 48, 39, 7, 6, 46, 7, 22, 32, 19, 8, 14, 38, 31, 25, 34, 50, 22, 34, 0, 26, 15, 46, 18, 30, 8, 26, 3, 36, 17, 12, 14, 43, 34, 11, 37, 17, 29, 19, 14, 28, 8, 35, 11, 50, 5, 29, 9, 13, 24, 5, 33, 40, 18, 5, 20, 45, 22, 13, 44, 45, 29, 4, 39, 23}Shuffle(Sequence[Random[0, 50], i, 1, 100]) → random10Monat, {19, 33, 21, 44, 37, 1, 8, 17, 11, 36, 20, 29, 14, 30, 17, 30, 3, 5, 49, 25, 37, 6, 37, 29, 29, 16, 33, 5, 1, 27, 33, 14, 28, 30, 6, 45, 9, 24, 32, 16, 28, 25, 41, 39, 49, 35, 29, 41, 27, 11, 45, 4, 17, 2, 6, 29, 26, 26, 23, 25, 50, 38, 44, 25, 34, 1, 30, 3, 39, 18, 1, 4, 23, 10, 28, 44, 49, 2, 8, 12, 44, 0, 34, 35, 34, 33, 19, 37, 30, 24, 40, 20, 0, 2, 20, 50, 23, 2, 37, 5}Shuffle(Sequence[Random[0, 50], i, 1, 100]) → random9Monat, {0, 39, 35, 20, 40, 27, 41, 33, 49, 31, 41, 28, 29, 7, 5, 26, 41, 16, 0, 37, 46, 28, 3, 35, 5, 26, 35, 40, 30, 0, 4, 27, 26, 17, 10, 2, 28, 9, 2, 8, 28, 27, 24, 29, 14, 16, 15, 26, 29, 18, 5, 18, 37, 21, 29, 37, 23, 30, 9, 13, 43, 32, 48, 0, 22, 32, 29, 36, 5, 32, 8, 6, 29, 30, 40, 50, 6, 45, 12, 26, 20, 14, 15, 46, 5, 15, 42, 50, 46, 41, 42, 21, 10, 48, 37, 35, 41, 31, 32, 21}Shuffle(Sequence[Random[0, 50], i, 1, 100]) → random8Monat, {3, 30, 14, 41, 8, 21, 16, 4, 23, 32, 4, 30, 35, 30, 3, 15, 26, 18, 42, 10, 6, 41, 27, 24, 34, 5, 43, 50, 8, 8, 40, 27, 20, 32, 31, 6, 17, 22, 40, 17, 34, 20, 17, 47, 35, 37, 25, 3, 48, 26, 37, 20, 18, 29, 35, 3, 8, 47, 0, 15, 48, 17, 23, 30, 47, 47, 9, 19, 29, 28, 21, 27, 2, 29, 26, 9, 20, 5, 12, 46, 9, 45, 50, 18, 36, 31, 45, 6, 48, 26, 46, 11, 8, 7, 43, 46, 38, 8, 27, 12}Shuffle(Sequence[Random[0, 50], i, 1, 100]) → random7Monat, {16, 31, 18, 45, 24, 10, 7, 3, 41, 0, 10, 12, 39, 15, 7, 4, 12, 20, 43, 4, 10, 28, 35, 30, 35, 43, 33, 4, 24, 10, 36, 28, 25, 38, 40, 28, 48, 48, 33, 10, 37, 21, 26, 45, 50, 27, 17, 20, 31, 33, 48, 23, 34, 5, 44, 40, 41, 30, 10, 46, 8, 45, 41, 27, 46, 13, 50, 39, 26, 33, 24, 12, 22, 30, 42, 44, 35, 36, 20, 10, 29, 27, 31, 29, 43, 44, 10, 12, 14, 6, 14, 23, 19, 39, 49, 12, 20, 7, 40, 22}Shuffle(Sequence[Random[0, 50], i, 1, 100]) → random6Monat, {5, 43, 22, 29, 18, 6, 44, 18, 44, 22, 43, 24, 6, 14, 25, 23, 35, 14, 46, 10, 5, 49, 34, 17, 49, 35, 16, 18, 40, 43, 6, 31, 16, 16, 0, 3, 27, 5, 50, 28, 48, 39, 15, 49, 33, 19, 25, 4, 21, 6, 49, 9, 28, 17, 18, 45, 16, 6, 34, 48, 17, 25, 16, 49, 31, 30, 13, 8, 41, 21, 26, 42, 16, 20, 35, 46, 27, 40, 6, 30, 35, 23, 50, 32, 46, 41, 12, 22, 27, 44, 15, 48, 44, 42, 35, 35, 38, 14, 17, 32}Shuffle(Sequence[Random[0, 50], i, 1, 100]) → random5Monat, {7, 50, 36, 2, 15, 29, 22, 49, 39, 15, 46, 4, 32, 39, 16, 39, 2, 0, 14, 43, 36, 47, 36, 12, 38, 23, 28, 40, 38, 34, 24, 7, 46, 6, 17, 44, 10, 16, 50, 27, 30, 49, 0, 20, 21, 19, 32, 48, 37, 35, 0, 10, 9, 39, 49, 48, 28, 22, 32, 6, 19, 33, 45, 27, 3, 23, 21, 38, 0, 40, 13, 44, 31, 38, 27, 11, 9, 11, 1, 31, 28, 11, 4, 45, 0, 38, 30, 2, 8, 40, 33, 24, 36, 11, 22, 12, 25, 27, 20, 10}Shuffle(Sequence[Random[0, 50], i, 1, 100]) → random4Monat, {29, 2, 6, 17, 43, 45, 11, 5, 46, 37, 13, 32, 11, 33, 0, 38, 36, 29, 8, 5, 21, 25, 32, 41, 49, 46, 35, 12, 43, 21, 16, 36, 7, 1, 1, 48, 22, 13, 24, 1, 1, 10, 46, 32, 22, 23, 20, 27, 35, 16, 8, 27, 1, 41, 24, 27, 29, 40, 21, 34, 39, 39, 39, 23, 41, 9, 5, 8, 23, 42, 50, 47, 17, 43, 42, 7, 12, 15, 19, 37, 10, 4, 15, 12, 2, 5, 18, 46, 35, 23, 6, 12, 22, 8, 13, 6, 37, 24, 20, 29}Shuffle(Sequence[Random[0, 50], i, 1, 100]) → random3Monat, {11, 8, 29, 43, 31, 6, 32, 0, 39, 0, 24, 5, 0, 13, 8, 7, 18, 13, 11, 38, 47, 7, 4, 35, 27, 7, 49, 43, 15, 49, 47, 27, 49, 34, 44, 15, 26, 22, 39, 7, 3, 22, 40, 11, 18, 19, 26, 48, 15, 24, 19, 13, 33, 9, 43, 13, 21, 8, 42, 22, 49, 4, 12, 39, 8, 0, 20, 1, 40, 0, 25, 30, 27, 4, 31, 50, 10, 35, 8, 24, 3, 41, 29, 2, 19, 39, 38, 11, 5, 14, 41, 24, 25, 42, 4, 3, 18, 31, 38, 43}Shuffle(Sequence[Random[0, 50], i, 1, 100]) → random2Monat, {36, 24, 22, 9, 39, 20, 9, 5, 44, 13, 7, 4, 1, 22, 43, 20, 31, 42, 21, 33, 23, 41, 0, 11, 17, 33, 50, 23, 36, 2, 15, 45, 25, 31, 42, 33, 26, 23, 27, 36, 1, 26, 26, 3, 35, 5, 15, 9, 7, 2, 12, 5, 28, 4, 19, 17, 50, 27, 50, 37, 25, 7, 37, 48, 34, 27, 12, 48, 9, 14, 2, 33, 47, 25, 33, 2, 27, 17, 12, 35, 43, 18, 44, 20, 8, 16, 30, 13, 42, 25, 46, 41, 37, 1, 2, 0, 12, 40, 45, 5}Shuffle(Sequence[Random[0, 50], i, 1, 100]) → random1Monat, {19, 20, 42, 50, 49, 26, 12, 14, 39, 44, 0, 28, 45, 46, 47, 49, 46, 40, 19, 42, 2, 48, 29, 4, 37, 50, 15, 48, 2, 38, 23, 4, 17, 7, 13, 11, 41, 5, 49, 1, 36, 19, 4, 19, 36, 32, 1, 34, 19, 49, 37, 11, 38, 3, 36, 48, 28, 4, 34, 1, 13, 5, 6, 27, 42, 32, 31, 8, 15, 48, 26, 21, 38, 27, 7, 33, 40, 23, 6, 0, 8, 46, 34, 11, 19, 7, 48, 43, 44, 38, 7, 46, 35, 7, 48, 26, 14, 35, 41, 21}Max(listAllMonths) → maxMin(listAllMonths) → minTextfield(input1) → InputBox1Textfield(input2) → InputBox2Polygon(PtopLeftCornerFeedback, PtopRightCornerFeedback, PbottomRightCornerFeedback, PbottomLeftCornerFeedback) → rectangleCorrect, rectangleCorrectS3, rectangleCorrectS4, rectangleCorrectS2, rectangleCorrectS1Append(true, Sequence[If[random1Monat(i) ≟ random1Monat(i - 1), false, true], i, 2, 100]) → stayXAppend(true, Sequence[If[random2Monat(i) ≟ random2Monat(i - 1), false, true], i, 2, 100]) → stayYRemove(Sequence[If[stayX(i), random1Monat(i), 0], i, 1, 100], Sequence[0, i, 1, 100]) → randomNosForXwithoutRepeatRemove(Sequence[If[stayY(i), random2Monat(i), 0], i, 1, 100], Sequence[0, i, 1, 100]) → randomNosForYwithoutRepeatElement(randomNosForXwithoutRepeat, Mod[questionCount, Length[randomNosForXwithoutRepeat]] + 1) → numXwithoutRepeatElement(randomNosForYwithoutRepeat, Mod[questionCount, Length[randomNosForYwithoutRepeat]] + 1) → numYwithoutRepeatDefined(((input1 * input2) * input3)) → fixedTextfield(input3) → InputBox3First(listAllMonths) → listFirstElementLast(listAllMonths) → listLastElementIsInteger(num1) → integer1IsInteger(num2) → integer2IsInteger(num3) → integer3IsInteger(num4) → integer4IsInteger(num5) → integer5IsInteger(num6) → integer6IsInteger(num7) → integer7IsInteger(num8) → integer8IsInteger(num9) → integer9IsInteger(num10) → integer10IsInteger(num11) → integer11IsInteger(num12) → integer12IsInteger(min) → integerMinIsInteger(max) → integerMaxIsInteger(range) → integerRangeMax(allMonths) → maxAllMonthsMin(allMonths) → minAllMonths
AI Drawing Prompt Reference
Create a graph of a randomly generated dataset to show its minimum, maximum, and range. First, generate data for 12 months, then calculate the minimum, maximum, and range for each dataset. Use text boxes to input students' calculations and compare them with the correct answers. Finally, display the minimum and maximum values using polygons and text boxes.
The prompt above was compiled from the original drawing commands and is for reference only.