
Experimental vs Theoretical Probability: Coin Toss Sampling Visualization
Loading the math board and drawing, please wait…
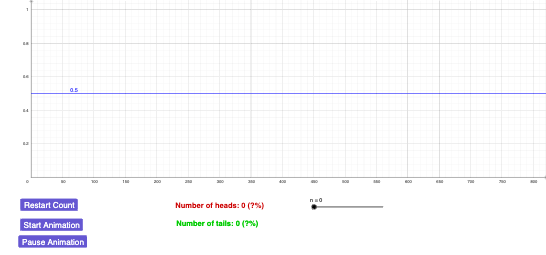
This GeoGebra example demonstrates how experimental probability (empirical frequency from repeated trials) compares to theoretical probability for a coin-toss process. By repeatedly generating random outcomes and updating statistics on the fly, learners can observe the characteristic randomness of small samples and how the empirical result tends to approach the theoretical probability as the sample size increases. Key concepts include probability & statistics, empirical frequency versus theoretical probability, representing probabilities with rational numbers (fractions), and using bar charts/bars to visualize counts and distributions. Construction highlights: it uses Random to generate the coin outcome (coin with interactive buttons button1–button4), Length to track the number of trials and CountIf to count occurrences of specific events (ones/zeroes and totals such as ones, zeroes, total, n), If to compute the empirical probabilities p and q from the counts, and Point/Ray to support comparison visuals (including labeled points A, B, C, D and a reference ray l1). Text objects (text1–text3) present the evolving probabilities and interpretation. Suitable for secondary school and early undergraduate probability instruction, classroom demonstrations, and exploratory activities.
GeoGebra Commands & Parameters
Random(0, 1) → coinLength(l1) → totalCountIf(x ≟ 1, l1) → onesPoint(yAxis) → BRay(B, C) → fCountIf(x ≟ 0, l1) → zeroesIf(coin ≟ 1, "Outcome: Head", "Outcome: Tail") → text1
AI Drawing Prompt Reference
Create a visualization of a coin toss experiment, including a button to randomly generate heads or tails, a counter to record the total number of tosses, counters to record the number of heads and tails, and a text box to display experimental and theoretical probabilities. First, generate a random coin result, then update the counters based on the number of tosses, and finally show the comparison between experimental and theoretical probabilities.
The prompt above was compiled from the original drawing commands and is for reference only.