
Normal Probabilities from a Table with Negative Z-scores
Loading the math board and drawing, please wait…
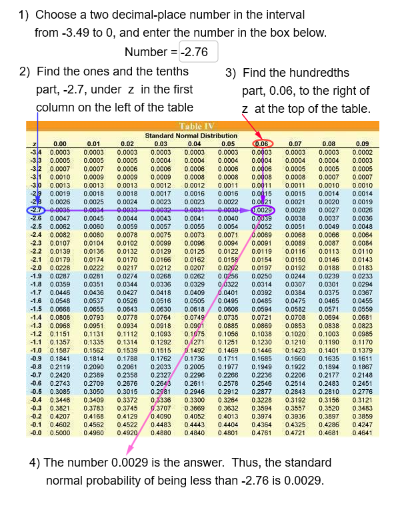
This interactive example demonstrates the process of finding probabilities from a standard normal distribution table, specifically focusing on cases starting with negative z-scores. It covers fundamental statistical concepts including the Standard Normal Distribution, Z-score calculations, and the relationship between the area under the curve and probability. The construction utilizes GeoGebra commands such as Vector, Normal, and OrthogonalLine for geometric layout, while employing Textfield, InputBox, and If statements to create a dynamic user interface for data entry and conditional display. This tool is ideal for high school and college students studying introductory statistics and probability.
GeoGebra Commands & Parameters
OrthogonalLine(E, xAxis) → aOrthogonalLine(E, yAxis) → bOrthogonalLine(E1, b) → dOrthogonalLine(C1, a) → cIntersect(c, d) → F0Normal(0, 1, A) → ProbVector(E1, F2) → vTextfield(A) → InputBox1Vector(F3, G) → tVector(C3, F1) → uVector(J, E2) → sVector(K, C2) → wIf(Ao ≟ At, ".0", "") → ZrT
AI Drawing Prompt Reference
Draw a standard normal distribution curve with the origin marked. Create perpendicular lines from the origin to the X and Y axes, then draw perpendicular lines from the feet of these lines to the other axis, marking their intersection. Based on an input negative Z-value, highlight the corresponding area under the curve, represent the area boundaries with vectors, and display the Z-value and probability.
The prompt above was compiled from the original drawing commands and is for reference only.