
Normal Probabilities from a Table with Positive Z's
Loading the math board and drawing, please wait…
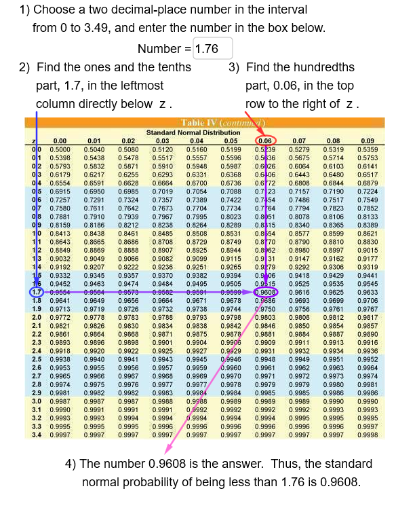
This example demonstrates how to calculate normal distribution probabilities from a table using positive z-scores. Key mathematical concepts include normal distribution, probability tables, and z-scores. Construction involves GeoGebra commands such as Line, OrthogonalLine, Vector, Intersect, etc. Suitable for high school students or college students learning probability statistics and data analysis.
GeoGebra Commands & Parameters
Line(E1, C) → dOrthogonalLine(B, yAxis) → aOrthogonalLine(B, xAxis) → bLine(D2, C) → cVector(K, E2) → zVector(E1, F2) → vIntersect(h, c, 1) → F1Textfield(A) → InputBox1Vector(D2, F1) → uVector(J, D1) → wNormal(0, 1, A) → PrbVector(F3, H) → sIf(Ao ≟ At, ".0", "") → ZrT
AI Drawing Prompt Reference
Draw a graph showing normal distribution probabilities, including x and y axes, and a line perpendicular to the x-axis. Plot the normal distribution curve on the x-axis and display a normal distribution table. Use vectors to represent z-scores and draw line segments intersecting the normal distribution curve. Add an input box for entering z-values and display the corresponding probability values.
The prompt above was compiled from the original drawing commands and is for reference only.