
Residuals on a Scatter Diagram Demo
Loading the math board and drawing, please wait…
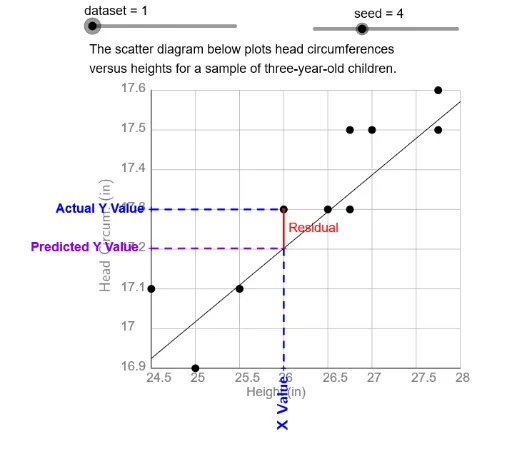
This example demonstrates plotting residuals on a scatter diagram, involving core math concepts like residuals, scatter plots, linear regression, and PMCC (Pearson's correlation coefficient). Key GeoGebra commands and objects used include Element, Min, Max, If, Sequence, Length, Segment, PMCC, VerticalText, and Text. Suitable for high school mathematics teaching on data fitting and residual analysis.
GeoGebra Commands & Parameters
Element(DtYSq, dataset) → DtY0Min(DtY0) → YDtMnMax(DtY0) → YDtMxElement(DtXSq, dataset) → DtX0Min(DtX0) → XMnMax(DtX0) → XMxIf((5 * XScLB) ≤ XScUB, (5 * XScLB), If[(2 * XScLB) ≤ XScUB, (2 * XScLB), XScLB]) → XAxScSequence(Mod[3 + (17 * k), 37] + 30, k, 1, 32) → OpSqElement(OpSq, dataset) → OpNm1Element(DtPlSq, Op1) → DtPlMin(XMnYht, XMxYht) → RgLnMnMin(RgLnMn, YDtMn) → YMnMax(XMnYht, XMxYht) → RgLnMxMax(RgLnMx, YDtMx) → YMxIf((5 * YScLB) ≤ YScUB, (5 * YScLB), If[(2 * YScLB) ≤ YScUB, (2 * YScLB), YScLB]) → YAxScLength(DtX0) → SizeSegment(GrOr, GrLR) → grhaxSegment(GrOr, GrUL) → grvaxSegment(RgLnLf, RgLnRt) → grrglnPMCC(DtX0, DtY0) → RSequence(Text[k, (AdpX(k) - 0.8, -2.2)], k, XAxMn, XAxMx, XAxSc) → XAxLbSequence(Text[k, (-5, AdpY(k) - 0.35)], k, YAxMn, YAxMx, YAxSc) → YAxLb_1Sequence(AdpX(Element[DtX0, k]), k, 1, Size) → PltXSequence(AdpY(Element[DtY0, k]), k, 1, Size) → PltYSequence((Element[PltX, k], Element[PltY, k]), k, 1, Size) → DtPntsElement(XAxTtlSq, dataset) → XAxTtlSequence(Segment[(0, AdpY(k)), (XScMx, AdpY(k))], k, YAxMn, YAxMx, YAxSc) → HrzGrdSequence(Segment[(AdpX(k), 0), (AdpX(k), GrTp)], k, XAxMn, XAxMx, XAxSc) → VrtGrdVerticalText(Element[YAxTtlSq, dataset], (-9, 32)) → YAxLbElement(DtX0, seed) → XdtElement(DtY0, seed) → YdtSegment(DtPt, PrdPt) → RsdSegment(DtPtY, DtPt) → YDtLnSegment(PrdPtY, PrdPt) → PrdLnMin(Ydt, YhtDt) → YRsdSegment(YRsdPt, DtPtX) → XdtLnVerticalText("X Value", (AdpX(Xdt) - 1.5, 0)) → XVlLbText("Actual Y Value", (-15, AdpY(Ydt)) - 0.5) → ActYLbText("Predicted Y Value", (-19, AdpY(YhtDt)) - 0.5) → PrdYLbText("Residual", RsdLbPt) → RsdLbl
AI Drawing Prompt Reference
Draw a scatter plot showing data points and their residuals. First, draw the X and Y axes, then plot the data points and calculate the residuals. Next, draw the regression line and residual lines for each data point. Finally, label the X-axis with X values and the Y-axis with actual Y values, predicted Y values, and residuals.
The prompt above was compiled from the original drawing commands and is for reference only.