
Function Graphs and Geometric Shapes Interaction Demo
Loading the math board and drawing, please wait…
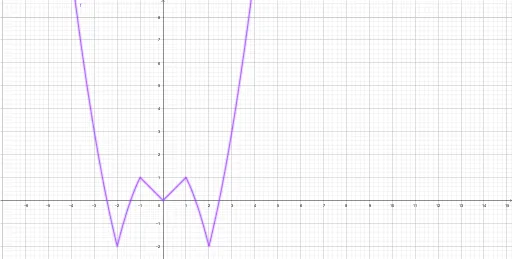
This example demonstrates the intersection points and dynamic changes between function graphs and geometric shapes (circle, straight lines). It involves core mathematical concepts such as functions, coordinate geometry, trigonometry, and expected value. Construction highlights include using GeoGebra commands/objects like f (function object), Slider Animation, and Locus. Suitable for middle school and above students to learn function graphs, geometric properties, and dynamic geometric changes, applicable in probability & statistics and calculus introductory teaching.
GeoGebra Commands & Parameters
f(x) = If[-1 ≤ x ≤ 1, abs(x), -2 ≤ x ≤ 2, (-x^(2)) + 2, x^(2) - 6]