
Function Graph and Integral Calculus Demo
Loading the math board and drawing, please wait…
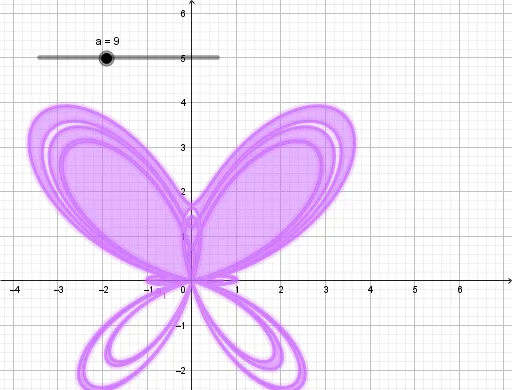
This example demonstrates function graph plotting and integral calculus using GeoGebra. It involves core math concepts like functions, continuity, and integral calculus. The construction uses the CurveCartesian command with objects a and a_1 for parameterization. Suitable for middle school and above students for teaching demonstrations and practice.
GeoGebra Commands & Parameters
CurveCartesian((ℯ^(sin(θ)) - (2 * cos((4 * θ))) + sin((1 / 24 * ((2 * θ) - π)))^(5); θ), θ, 0, (a * π)) → a_1