
3-Set Venn Diagram
Loading the math board and drawing, please wait…
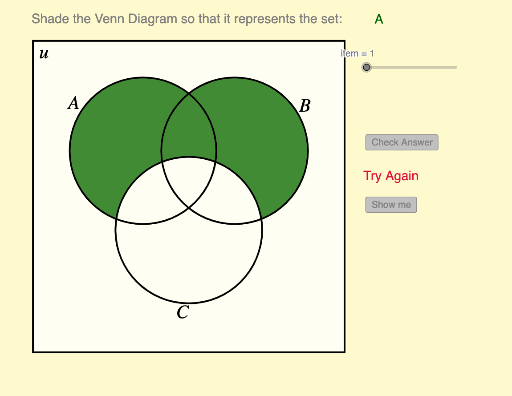
This example demonstrates a Venn diagram for three sets, illustrating intersections and unions among them. Core math concepts include set theory and geometric distribution in probability statistics. Construction highlights involve GeoGebra commands/objects like Polygon, Segment, If, Element, Length, Corner. Suitable for high school mathematics and probability/statistics education.
GeoGebra Commands & Parameters
Polygon(I, H, 3) → poly2, r, s, t, JSegment((x_1, y_1), (x_1, y_2)) → eSegment((x_1, y_2), (x_2, y_2)) → fSegment((x_2, y_1), (x_2, y_2)) → gSegment((x_2, y_1), (x_1, y_1)) → hIf(IsGreen1, 0, 1) → RB1If(IsGreen1, 0.4, 1) → G1If(IsGreen2, 0, 1) → RB2If(IsGreen3, 0, 1) → RB3If(IsGreen8, 0, 1) → RB8If(IsGreen2, 0.4, 1) → G2If(IsGreen3, 0.4, 1) → G3If(IsGreen8, 0.4, 1) → G8Element(problem, item, 1) → textitemLength(problem) → iElement(problem, item, 2) → keyPolygon(Corner[1], Corner[2], Corner[3], Corner[4]) → poly1, l, m, n, qCorner(5) → GIf(IsGreen4, 0.4, 1) → G4If(IsGreen5, 0.4, 1) → G5If(IsGreen6, 0.4, 1) → G6If(IsGreen7, 0.4, 1) → G7If(IsGreen4, 0, 1) → RB4If(IsGreen5, 0, 1) → RB5If(IsGreen6, 0, 1) → RB6If(IsGreen7, 0, 1) → RB7
AI Drawing Prompt Reference
Draw a Venn diagram for three sets using three circles to represent each set and their intersections. Start by drawing the three circles, then add the intersection areas between them, and finally label the sets and intersection regions.
The prompt above was compiled from the original drawing commands and is for reference only.