
Who's in the Lead?
Loading the math board and drawing, please wait…
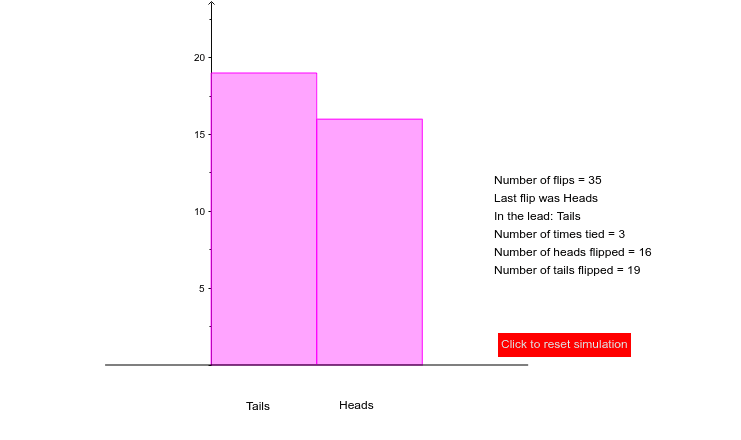
This example demonstrates a probability and statistics-based game simulation where coin flips determine the leader. Core math concepts include probability, statistics, piecewise functions, linear equations, and percentages. It uses GeoGebra commands like CountIf, Histogram, Segment, Last, If, and objects such as data, n, flips, etc., for data processing, statistical analysis, and dynamic visualization. Suitable for high school students learning probability statistics and data analysis, ideal for classroom demonstrations and interactive exploration.
GeoGebra Commands & Parameters
CountIf(x ≟ 0 ∨ x ≟ 1, data) → aCountIf(x ≟ 1, data) → countheadsCountIf(x ≟ 0, data) → counttailsHistogram({0, 1, 2}, data + 0.5) → bSegment((-1, 0), (3, 0)) → cLast(data) → list2If(countheads ≟ 0 ∧ counttails ≟ 0, -1, ((-0.25) * Max[countheads, counttails])) → yminIf(countheads ≟ 0 ∧ counttails ≟ 0, 5, (1.25 * Max[countheads, counttails])) → ymax
AI Drawing Prompt Reference
Create a visualization for a probability and statistics-based game simulation involving coin flips, showing a histogram to represent data distribution, and a dynamic line segment on the coordinate axis whose height changes based on the count of heads and tails, illustrating the application of probability and statistics.
The prompt above was compiled from the original drawing commands and is for reference only.