
Slide Number or Glisse Nombre: Interactive Math Demo
Loading the math board and drawing, please wait…
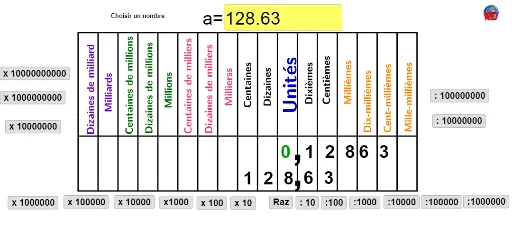
This GeoGebra example, titled 'Slide number ou glisse nombre', demonstrates an interactive environment where a slider dynamically changes numerical values, instantly updating associated text, points, lines, segments, and vectors. It covers core mathematical concepts including arithmetic, functions, angles, cosine, quadratic functions, normal distribution, and expected value, showcasing the power of dynamic visualization in mathematics. The construction uses commands such as Textfield for input boxes, Point for defining key points, If for conditional logic, Line, Segment, and Vector for geometric elements, RotateText for rotating labels, and Sequence for generating ordered objects. Numerous named objects (lar, aa, a1–a8, liste2, ChampTexte1, etc.) are linked to create a complex, responsive system. This resource is suitable for middle school through university mathematics education, particularly for teaching function transformations, dynamic geometry, and probability/statistics concepts. It also serves as an excellent template for educators creating interactive lessons.
GeoGebra Commands & Parameters
Textfield(aa) → ChampTexte1Point(xAxis) → AIf(a1 ≟ 0, " ", " " + a1) → Textea1If(a1 ≟ 0 ∧ a2 ≟ 0, " ", "" + a2) → Textea2If(a1 ≟ 0 ∧ a2 ≟ 0 ∧ a3 ≟ 0, " ", "" + a3) → Textea3If(a1 ≟ 0 ∧ a2 ≟ 0 ∧ a3 ≟ 0 ∧ a4 ≟ 0, " ", "" + a4) → Textea4If(a1 ≟ 0 ∧ a2 ≟ 0 ∧ a3 ≟ 0 ∧ a4 ≟ 0 ∧ a5 ≟ 0, " ", "" + a5) → Textea5If(a1 ≟ 0 ∧ a2 ≟ 0 ∧ a3 ≟ 0 ∧ a4 ≟ 0 ∧ a5 ≟ 0 ∧ a6 ≟ 0, " ", "" + a6) → Textea6If(a1 ≟ 0 ∧ a2 ≟ 0 ∧ a3 ≟ 0 ∧ a4 ≟ 0 ∧ a5 ≟ 0 ∧ a6 ≟ 0 ∧ a7 ≟ 0, " ", "" + a7) → Textea7If(a1 ≟ 0 ∧ a2 ≟ 0 ∧ a3 ≟ 0 ∧ a4 ≟ 0 ∧ a5 ≟ 0 ∧ a6 ≟ 0 ∧ a7 ≟ 0 ∧ a8 ≟ 0, " ", "" + a8) → Textea8If(d4 ≤ 0, " ", "" + d4) → texted4If(d3 ≤ 0, " ", "" + d3) → texted3If(d2 ≤ 0, " ", "" + d2) → texted2If(d1 ≤ 0, " ", "" + d1) → texted1If(d1 > 0, ",", "") → textevirIf(a1 > 0, 8, If[a2 > 0, 5.2, If[a3 > 0, 3.7, If[a4 > 0, 2.2, If[a5 > 0, 1, If[a6 > 0, -0.5, If[a7 > 0, -2, -4]]]]]]) → avLine(E, xAxis) → bIf(0.01 ≥ ff ≥ 0.39, 1, If[0.92 ≥ ff ≥ 1.2, 2, If[ff ≥ 1.86, 3, If[ff ≥ 2.48, 4, If[ff > 3, 5, If[ff ≥ 3.64, 5, If[ff > 4.296, 6, 0]]]]]]) → ajIf(x(F) < x(D), 1, 0) → ajouIf(3.7 < x(F) < 4.5, 10, If[4.5 < x(F) < 5.2, 0.1, If[5.2 < x(F) < 6, 0.01, 1]]) → cIf(a1 ≟ 0 ∧ a2 ≟ 0 ∧ a3 ≟ 0 ∧ a4 ≟ 0 ∧ a5 ≟ 0 ∧ a6 ≟ 0 ∧ a7 ≟ 0, 1, If[a1 ≟ 0 ∧ a2 ≟ 0 ∧ a3 ≟ 0 ∧ a4 ≟ 0 ∧ a5 ≟ 0 ∧ a6 ≟ 0, 2, If[a1 ≟ 0 ∧ a2 ≟ 0 ∧ a3 ≟ 0 ∧ a4 ≟ 0 ∧ a5 ≟ 0, 3, If[a1 ≟ 0 ∧ a2 ≟ 0 ∧ a3 ≟ 0 ∧ a4 ≟ 0, 4, If[a1 ≟ 0 ∧ a2 ≟ 0 ∧ a3 ≟ 0, 5, If[a1 ≟ 0 ∧ a2 ≟ 0, 6, If[a1 ≟ 0, 7, 8]]]]]]) → unIf(d4 ≤ 0 ∧ d3 ≟ 0 ∧ d2 ≟ 0 ∧ d1 ≠ 0, 1, If[d4 ≤ 0 ∧ d3 ≟ 0 ∧ d2 ≠ 0 ∧ d1 ≠ 0, 2, If[d4 ≤ 0 ∧ d3 ≠ 0 ∧ d2 ≠ 0 ∧ d1 ≠ 0, 3, If[d4 > 0 ∧ d3 ≠ 0 ∧ d2 ≠ 0 ∧ d1 ≠ 0, 4, 0]]]) → deciSegment(B - (0, 0.5), C - (0, 0.5)) → dVector(F, F + (0.25, 0)) → uVector(F, F - (0.25, 0)) → vRotateText("Unités", 90°) → texte41RotateText("Dizaines", 90°) → texte12RotateText("Centaines", 90°) → texte25RotateText("Millierss", 90°) → texte26RotateText("Dixièmes", 90°) → texte27RotateText("Centièmes", 90°) → texte28RotateText("Millièmes", 90°) → texte29RotateText("Centaines de milliers", 90°) → texte30RotateText("Dizaines de milliers", 90°) → texte31RotateText("Millions", 90°) → texte32RotateText("Centaines de millions", 90°) → texte33RotateText("Dizaines de millions", 90°) → texte34RotateText("Milliards", 90°) → texte35RotateText("Dizaines de milliard", 90°) → texte36RotateText("Cent-millièmes", 90°) → texte38RotateText("Mille-millièmes", 90°) → texte39RotateText("Dix-millièmes", 90°) → texte37Segment(B + (0, 2.7), C + (0, 2.7)) → fSequence(Segment[B + (i, 0), B + (i, 2.7)], i, 0, 11, 8 / lar) → liste3Segment(B - (0, 2.2), C - (0, 2.2)) → eSequence(Segment[B + (i, 0), B + (i, -2.2)], i, 0, 11, 8 / lar) → liste1
AI Drawing Prompt Reference
Create an interactive number slider demo: place a draggable point on the x-axis with an input box nearby. Based on the entered number, display digit labels above a horizontal line for integer places (units, tens, hundreds, etc.) only when non-zero, separated by commas. Below the line, show decimal digit labels (tenths, hundredths, etc.) similarly. Use vertical segments to divide columns for each place, with unit labels above and decimal labels below. Add arrows to indicate the currently selected digit, and use conditional logic to show or hide labels. Keep the layout clear for educational purposes.
The prompt above was compiled from the original drawing commands and is for reference only.