
The Root of the Problem: Visualizing Quadratic Roots
Loading the math board and drawing, please wait…
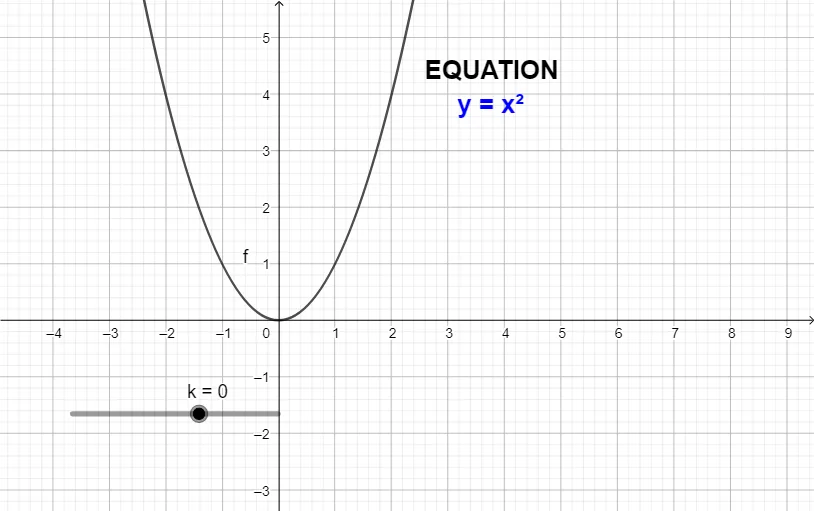
This GeoGebra example dynamically illustrates the relationship between a quadratic function's graph and its roots (x-intercepts), making the geometric meaning of solving quadratic equations visually clear. Core mathematical concepts include quadratic functions, roots of quadratic equations, the discriminant's role in determining the number of real roots, and the relationship between coefficients and roots. Construction highlights: using GeoGebra, the quadratic function object k is defined, its graph f is plotted, and text objects text1 and text2 are added to dynamically display root values or discriminant information, possibly with sliders or input boxes to adjust coefficients and observe real-time changes. Suitable for middle and high school students learning quadratic functions and equations, this example serves as an effective tool for classroom demonstrations or self-directed exploration, bridging algebraic solutions with graphical representations.
GeoGebra Commands & Parameters
Numeric k(0)y = ((x - k) * (x - (2 * k)))
AI Drawing Prompt Reference
Draw a coordinate plane with a parabola whose shape is controlled by a slider parameter k. The parabola intersects the x-axis at two points, k and 2k, which move dynamically as k changes. Add text labels near the graph that display the current root values and the discriminant information, illustrating how the number of real roots relates to the coefficients. The visual should clearly show the geometric connection between the quadratic function's graph and its roots.
The prompt above was compiled from the original drawing commands and is for reference only.