
Quadratic Equations: Geometry of Coefficient–Solution Relationships
Loading the math board and drawing, please wait…
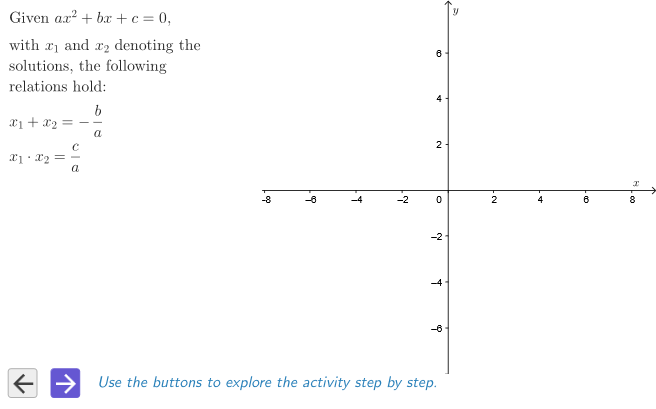
① This interactive GeoGebra example visualizes the geometric relationships between the coefficients (a, b, c) of a quadratic equation ax²+bx+c=0 and its solutions (roots), accompanied by algebraic exploration. ② Core mathematical concepts include quadratic equations, intersections of parabolas and lines, tangent and secant lines, similar triangles, fractions, and rectangle areas, linking symbolic algebra with geometric intuition. ③ Construction highlights: uses GeoGebra commands Point, Polygon, Segment, and Intersect to build points, polygons, segments, and intersection points; sliders (aSli, bSli, cSli) and animation buttons (btnForward, btnBack, btnRewind) control coefficient changes, while text objects (text1, text2, etc.) display instructions and numerical data for interactive exploration. ④ Suitable for middle or high school algebra/geometry classes to understand the relationship between roots and coefficients, and for teacher demonstrations or student self-study, deepening comprehension of completing the square, the discriminant, and Vieta's formulas from a geometric perspective.
GeoGebra Commands & Parameters
Point(xAxis) → PEEPSTPolygon({PP1, PP2, PP3, PP4}) → peepSegment((x(PP1), 0), (x(PP2) + 0.1, 0)) → fakeXSegment((0, y(PP1)), (0, y(PP3) + 0.1)) → fakeYIntersect(ip, r, 2) → AIntersect(ip, r, 1) → B
AI Drawing Prompt Reference
Draw a parabola intersecting a line. Define the parabola using points P1, P2, P3, and P4. Draw a horizontal line segment from P1 to P2 and a vertical line segment from P1 to P3. Find the intersection of these segments and label them as A and B. Ensure the diagram is clear and labeled to help understand the relationship between coefficients and roots.
The prompt above was compiled from the original drawing commands and is for reference only.