
Quadratic Graphs and Roots: Visualizing Intersections
Loading the math board and drawing, please wait…
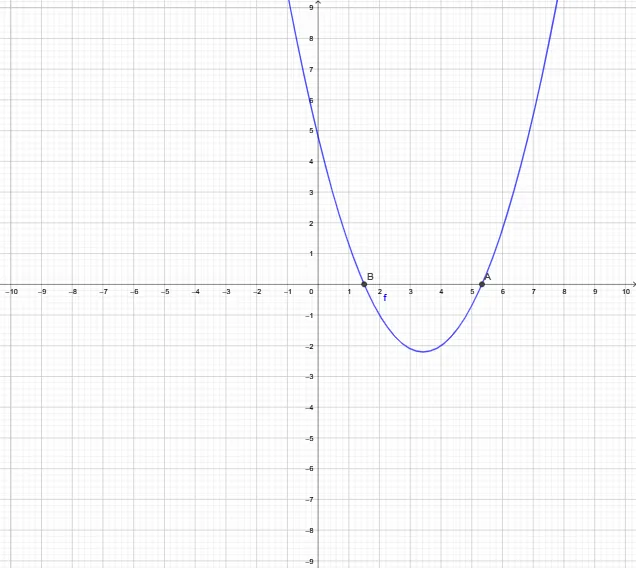
①This GeoGebra example dynamically demonstrates the relationship between the graph of a quadratic function and its roots, showing where the parabola crosses the x-axis and how these intersections correspond to solutions of the quadratic equation. ②Core mathematical concepts include quadratic functions, roots of quadratic equations, intersections of function graphs with axes, and the geometric interpretation of roots. ③Construction highlights: the Intersect command is used to find intersection points A and B between the quadratic function f and the x-axis (or a line), with objects a, b, c likely serving as coefficients or parameters; adjusting these parameters changes the parabola and the roots. ④Suitable for middle and high school students learning quadratic functions and equations, as well as for teachers demonstrating the discriminant and root behavior in class, or for self-study to explore how coefficients affect the roots.
GeoGebra Commands & Parameters
Intersect(f, xAxis, 1) → AIntersect(f, xAxis, 2) → B