
Dynamic Exploration of Linear Functions
Loading the math board and drawing, please wait…
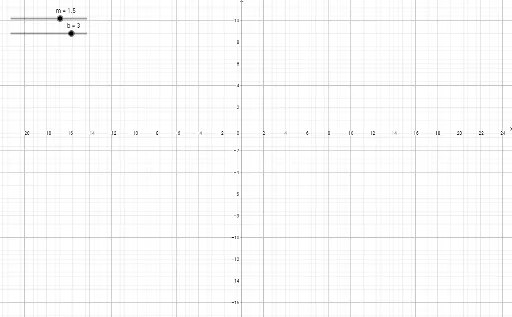
This GeoGebra example dynamically visualizes the graph of a linear function y = mx + b using interactive sliders for the slope (m) and y-intercept (b). It demonstrates how changes in these parameters affect the line's steepness and vertical position, reinforcing core concepts of linear functions, slope, and intercept. The construction utilizes GeoGebra objects m, b, and f, along with slider-based parameter control. Ideal for middle and high school mathematics, it supports classroom instruction and independent student exploration of function behavior and transformations.
GeoGebra Commands & Parameters
Numeric m(1.5)Numeric b(3)f(x) = (m * x) + b
AI Drawing Prompt Reference
Draw a dynamic graph of a linear function with two sliders to control the slope and y-intercept, observe how changes in these parameters affect the steepness and position of the line, and visualize the dynamic behavior of the line.
The prompt above was compiled from the original drawing commands and is for reference only.