
Fun Multiplication Tables
Loading the math board and drawing, please wait…
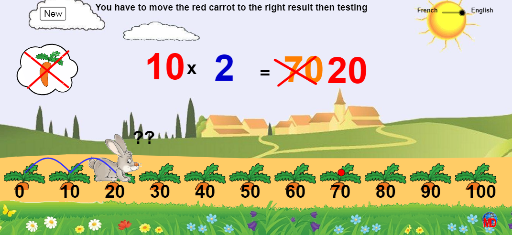
This example demonstrates multiplication tables through geometric visualization, blending abstract numbers with interactive graphics. It covers core concepts like vectors, functions, sequences, and coordinate geometry. Construction involves commands such as Intersect, Vector, If, Function, Sequence, Point, Segment, CircumcircleArc, Circle, and Polygon. Ideal for middle school and above to intuitively understand the connection between multiplication tables, vectors, and functions, enhancing engagement.
GeoGebra Commands & Parameters
Intersect(xAxis, yAxis) → AVector(A, B) → u1If(u ≟ 1, 12, If[u ≟ 2, 7, If[2 < u ≤ 4, 3.9, If[4 < u ≤ 6, 2.4, If[6 < u ≤ 8, 1.75, 1.5]]]]) → g_1Function(abs(sin(x)), 0, (t * π)) → fFunction(abs(sin(x)), (o * π), (t * π)) → gSequence(A + (i, 0), i, 0, 31.41592653589793, 3.141592653589793) → liste1Point(liste1) → VSegment(A, C) → aSequence(Text[i, Element[liste1, i + 1] - (0.21, 1)], i, 0, 10) → liste2CircumcircleArc(F, G, H) → cCircumcircleArc(H, I, J) → dCircumcircleArc(J, K, L) → eCircumcircleArc(L, M, N) → hCircumcircleArc(N, O, P) → kCircumcircleArc(P, Q, F) → pCircle(R, S) → qCircle(T, 0.2) → rSegment(W, Z) → bSegment(A_1, B_1) → iPolygon(C_1, D_1, M_1, N_1, O_1, P_1, Q_1, R_1, S_1, T_1, E_1, F_1, G_1, H_1, I_1, J_1, K_1, L_1) → poly1, c_1, l_1, m_1, n_1, o_1, p_1, q_1, r_1, s_1, t_1, d_1, e_1, f_1, g_2, h_1, i_1, j_1, k_1Polygon(F, H, J, L, N, P) → poly2, f_2, h_2, j, l, n, p_2CircumcircleArc(F, G, H) → sCircumcircleArc(H, I, J) → c_2CircumcircleArc(H, I, J) → d_2CircumcircleArc(J, K, L) → e_2CircumcircleArc(L, M, N) → k_2CircumcircleArc(P, Q, F) → q_2CircumcircleArc(P, Q, F) → r_2CircumcircleArc(N, O, P) → s_2Circle(T, 0.2) → t_2Circle(R, S) → c_3Segment(V_1, W_1) → mSegment(Z_1, A_2) → b_1Sequence(Translate[image3, Vector[(i * u1)]], i, 1, 10) → liste3Sequence(Text[(z * i), Element[liste1, i + 1] - (0.75, 1.75)], i, 0, 10, 1) → liste4
AI Drawing Prompt Reference
Create a geometric visualization of multiplication tables featuring coordinate axes, vectors, and sine function graphs. Use vectors to represent different multiples, with the sine function curve changing based on parameters. Combine circles and arcs to form geometric patterns, illustrating the connection between multiplication and geometry. Start by drawing the axes and vectors, then plot the sine function, followed by constructing geometric shapes with circles and arcs, and finally add text labels for values, presenting an intuitive geometric representation of multiplication tables.
The prompt above was compiled from the original drawing commands and is for reference only.