
When is too much overlap too much?
Loading the math board and drawing, please wait…
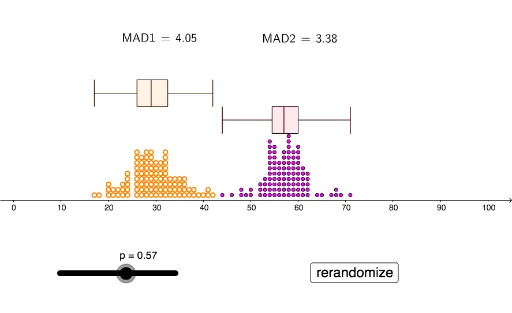
This example demonstrates and visualizes the overlap of different probability distributions, such as binomial and normal distributions. Key math concepts include probability & statistics, distribution characteristics, definite integrals, transformations, and combinatorics. It is constructed using GeoGebra commands like Sequence, DotPlot, mad, BoxPlot, and LaTeX, with objects like l1, l2, p, l3, l4, MAD1, MAD2, etc. Suitable for high school students and math enthusiasts studying probability distributions and statistical properties.
GeoGebra Commands & Parameters
Sequence(RandomBinomial[100, 0.3], w, 1, 100) → l1DotPlot(l1, false, 0.2) → l2Sequence(RandomBinomial[100, p], w, 1, 100) → l3DotPlot(l3, false, 0.2) → l4mad(l1) → MAD1mad(l3) → MAD2BoxPlot(4, 0.5, l1) → aBoxPlot(3, 0.5, l3) → bBoxPlot(4, 0.5, l1) → cBoxPlot(3, 0.5, l3) → dLaTeX(MAD1, true, true) → text1LaTeX(MAD2, true, true) → text2
AI Drawing Prompt Reference
Create a visualization showing the overlap of different probability distributions, including binomial and normal distributions, using dot plots for random samples and box plots to display data distribution characteristics, with annotations for the mean absolute deviation of both distributions. Start by generating random binomial distribution data and plotting it as a dot plot and box plot, then repeat the process for a binomial distribution with a variable parameter, and finally annotate the mean absolute deviation values for both distributions.
The prompt above was compiled from the original drawing commands and is for reference only.