
Distance, Speed, Time Relationship Demo
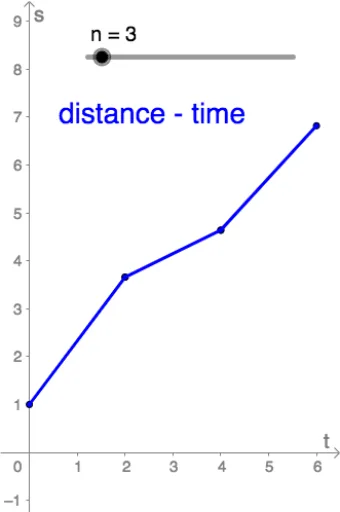
Loading the math board and drawing, please wait…
This example demonstrates the fundamental relationship between distance, speed, and time through dynamic graphics, illustrating how speed variations affect travel distance. Core math concepts include functions, derivatives, sequences, and probability & statistics. GeoGebra commands used are Sequence, f, f', n, p1, p2, p3, s1, s2, a1, text1, text2. It is suitable for high school students learning calculus, probability & statistics, and function graphing, as well as for visualizing kinematics problems in physics education.
GeoGebra Commands & Parameters
Sequence(((6 / n * i), f((6 / n * i))), i, 0, n - 1) → p1Sequence(((6 / n * i), f((6 / n * i))), i, 1, n) → p2Sequence(Segment[p1(i), p2(i)], i, 1, n) → s1Sequence(((6 / n * i), f'((6 / n * i))), i, 0, n - 1) → p3Sequence(Segment[p3(i), p3(i) + (6 / n, 0)], i, 1, n) → s2Sequence(Polygon[p3(i), p3(i) + (6 / n, 0), ((6 / n * i), 0), ((6 / n * (i - 1)), 0)], i, 1, n) → a1