
Regression: Polynomial and Sine Fitting with GeoGebra
Loading the math board and drawing, please wait…
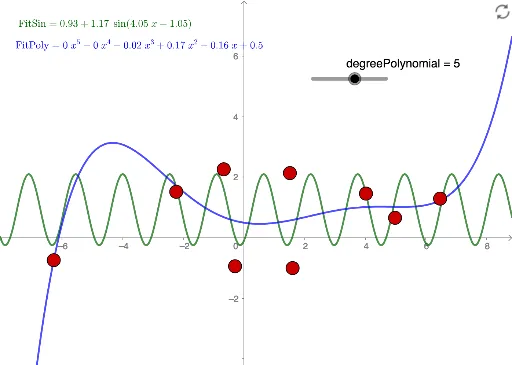
①This GeoGebra example demonstrates regression analysis by fitting sine and polynomial functions to a set of data points, visually comparing the resulting curves. ②Core mathematical concepts include regression, least-squares fitting, sine functions, polynomial functions, and function approximation, bridging statistics and graphing. ③Construction highlights: using FitSin and FitPoly commands to generate fitted functions f and g, with objects including data points A through I, list L_1, polynomial degree degreePolynomial, text1 and text2 for displaying results, and additional solid geometry objects (Archimedean, Pyramid, Prism) possibly for extension or comparison. ④Suitable for high school to undergraduate statistics or precalculus courses, helping students understand data modeling, goodness of fit, and how different function forms describe data, also useful for exploratory learning.
GeoGebra Commands & Parameters
FitSin(L_1) → fFitPoly(L_1, degreePolynomial) → g
AI Drawing Prompt Reference
Plot a set of data points and fit them with a sine function and a polynomial function, showing the fitted curves, label the degree of the polynomial function, differentiate the data points and fitted curves with colors, and add some geometric shapes in the background for visual enhancement.
The prompt above was compiled from the original drawing commands and is for reference only.