
Self-Assessment: Critical Points of Modulus (Absolute Value) Functions
Loading the math board and drawing, please wait…
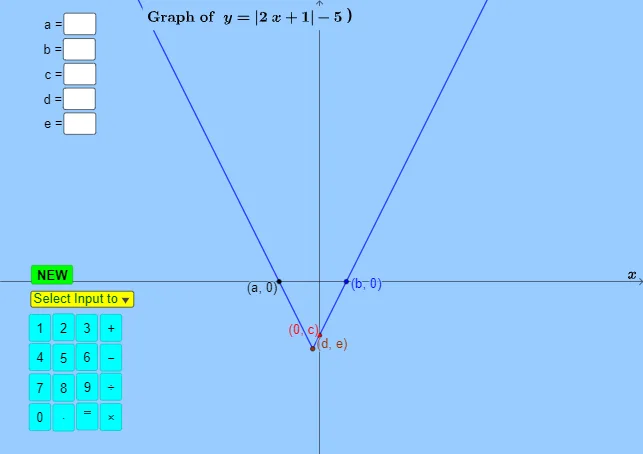
This GeoGebra example provides a self-assessment activity that generates modulus (absolute value) functions at random and asks students to identify and justify their critical points/key vertices from the graph. It highlights the visual phenomenon that absolute value functions form piecewise linear “V”-type shapes, where the turning point (the vertex) plays the role of the critical/important point, and how maximum/minimum-related quantities can be determined. The core mathematics includes absolute value (modulus) functions, interpretation of critical points in a piecewise-linear setting, and using computed extrema/target quantities (Max/Min) to verify answers. Construction and interaction are built from GeoGebra commands and objects such as RandomElement for parameter generation (e_r, c, m, a, b, A, B), Simplify for algebraic cleanup, Max/Min for key values P_{max} and P_{min}, and multiple input fields (Textfield and InputBox1–InputBox5) for student-proposed solutions (textinputa–textinpute, inputanswera–inputanswerd). Logic is handled with If, while LaTeX, Text, and Corner format the solutions (textfirstsolution, textsecondsolution), supported by buttons (button1, button2) for checking and retrying. Suitable for middle/high school through early calculus preparation, and for classroom practice or formative assessment on function graph reading and critical-point concepts.
GeoGebra Commands & Parameters
RandomElement({-7, -6, -5, -4, -3, -2, -1, 1, 2, 3, 4, 5, 6, 7}) → e_rRandomElement({-5, -4, -3, -2, -1, 1, 2, 3, 4, 5}) → cRandomElement({-2, -1, 1, 2, 3}) → mSimplify(e_r - (sgn(e_r) * abs((m * x) + c))) → fMax(f, -100, 100) → P_{max}Min(f, -100, 100) → P_{min}Textfield(textinputa) → InputBox1Textfield(textinputb) → InputBox2Textfield(textinputc) → InputBox3Textfield(textinputd) → InputBox4Textfield(textinpute) → InputBox5If(round(abs(x(P_{max})), 0) ≟ 100, P_{min}, P_{max}) → DCorner(InputBox1, 3) → AB1Corner(InputBox2, 3) → AB2Corner(InputBox3, 3) → AB3Corner(InputBox4, 3) → AB4Corner(InputBox5, 3) → AB5LaTeX(If[checked, If[answercorrectb, "\text{ }" + "\large\textcolor{blue}{" + (UnicodeToText[{10003}] + (UnicodeToText[{9786}])), "\text{ }" + "\textcolor{red}" + (UnicodeToText[{10060}] + (UnicodeToText[{9785}]))], ""]) → textfeedbackbLaTeX(If[checked, If[answercorrectc, "\text{ }" + "\large\textcolor{blue}{" + (UnicodeToText[{10003}] + (UnicodeToText[{9786}])), "\text{ }" + "\textcolor{red}" + (UnicodeToText[{10060}] + (UnicodeToText[{9785}]))], ""]) → textfeedbackcLaTeX(If[checked, If[answercorrectd, "\text{ }" + "\large\textcolor{blue}{" + (UnicodeToText[{10003}] + (UnicodeToText[{9786}])), "\text{ }" + "\textcolor{red}" + (UnicodeToText[{10060}] + (UnicodeToText[{9785}]))], ""]) → textfeedbackdLaTeX(If[checked, If[answercorrecte, "\text{ }" + "\large\textcolor{blue}{" + (UnicodeToText[{10003}] + (UnicodeToText[{9786}])), "\text{ }" + "\textcolor{red}" + (UnicodeToText[{10060}] + (UnicodeToText[{9785}]))], ""]) → textfeedbacke
AI Drawing Prompt Reference
Draw a graph of an absolute value function generated with random parameters. The graph should show a V-shaped shape. Mark the maximum and minimum points on the graph. Provide input fields for students to enter key point coordinates and provide feedback to verify answers.
The prompt above was compiled from the original drawing commands and is for reference only.