
Grouped Data Statistics Calculator: Median, Quartiles, and IQR for Box Plots
Loading the math board and drawing, please wait…
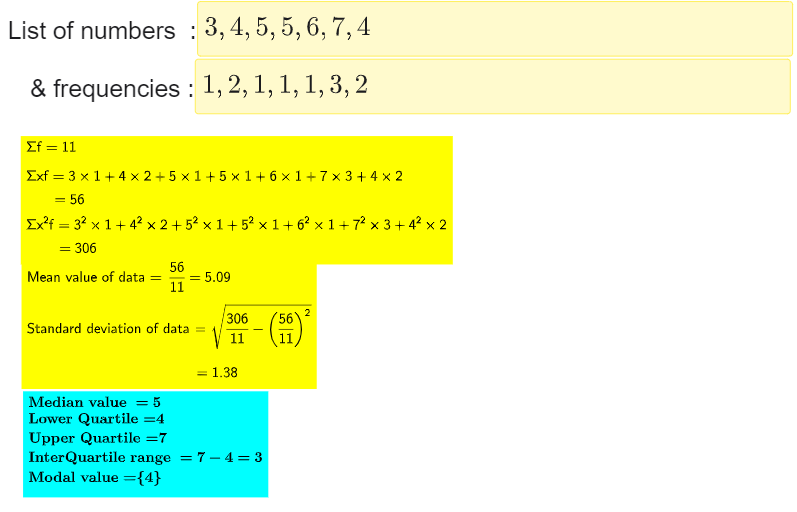
This example demonstrates an interactive utility for processing grouped data and computing key descriptive statistics that underlie graphs such as box plots. It focuses on determining the median and the quartiles Q1 and Q3, then deriving the interquartile range IQR = Q3 − Q1. It also supports classic measures of location and spread such as the mean and standard deviation, providing numerical outputs that can be checked and visualized. The construction uses core ideas of sorting and aggregation for grouped datasets, plus quantile computation for ordered values. In GeoGebra, the build relies on commands including Textfield (for inputs and displaying results), Length (dataset size), Sequence (to generate index/sample sequences), Sum (to compute totals, mean-related sums, and squared-sum quantities), Median (median extraction), Q3 and Q1 (quartile computation), and Sort (ordering data to ensure correct quantiles). The setup also derives intermediate sums (e.g., sumx, sumxsq) and produces labeled outputs and verification flags (e.g., meancheckok, stddevcheckok) for reliable interpretation. Suitable for later secondary school through early university courses, especially for teaching grouped-data statistics and preparing box-plot quartile values.
GeoGebra Commands & Parameters
Textfield(l1) → InputBox1Length(l1) → aTextfield(l1f) → InputBox2Sequence(1, t, 1, a) → l2Sum((l1^(2) * l1f)) → sumxsqSum((l1 * l1f)) → sumxSum(l1f) → sumfMedian(l1, l1f) → medianvQ3(l1, l1f) → Q3Q1(l1, l1f) → Q1Sum(Sequence[Element[l1, i] + "×" + (Element[l1f, i] + If[i ≟ a, "", "+"]), i, 1, a, 1]) → textsumxSum(Sequence[Element[l1, i] + "²" + "×" + (Element[l1f, i] + If[i ≟ a, "", "+"]), i, 1, a, 1]) → textsumsqxSort(Flatten[Sequence[Sequence[Element[l1, k], j, 1, Element[l1f, k]], k, 1, a]]) → l1all
AI Drawing Prompt Reference
Create an interactive statistics calculator for processing grouped data, calculating median, quartiles (Q1 and Q3), and interquartile range (IQR = Q3 - Q1). Input two datasets: one for data points and one for their frequencies. Display computed median, Q1, Q3, IQR, as well as sums, squared sums, mean, and standard deviation. Sort the data points and visualize the distribution of grouped data.
The prompt above was compiled from the original drawing commands and is for reference only.