
Binomial Distribution Demo by Malin Christersson
Loading the math board and drawing, please wait…
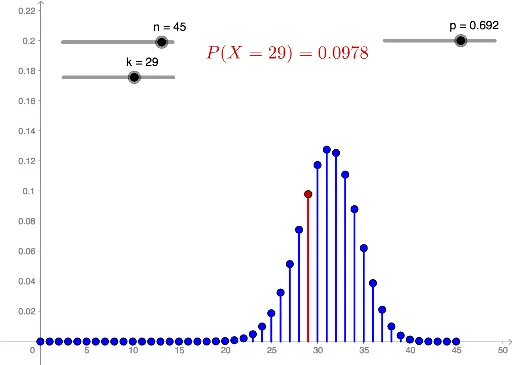
This example demonstrates the probability mass function of the binomial distribution and its variation patterns. The core mathematical concepts involved include probability & statistics, binomial distribution, and function graphing. The construction utilizes GeoGebra commands such as Sequence (for sequences) and Segment (for line segments) to plot the distribution graph and segments. Suitable for high school and above students to learn and understand the characteristics of the binomial distribution in probability statistics.
GeoGebra Commands & Parameters
Sequence(((nCr[n, k] * p^(k)) * (1 - p)^(n - k)), k, 0, n) → sSequence((i, Element[s, i + 1]), i, 0, n) → pointsSequence(Segment[Element[points, i + 1], (i, 0)], i, 0, n) → segmentsSegment(Element[points, k + 1], (k, 0)) → f