
Attracting Fixed Points
Loading the math board and drawing, please wait…
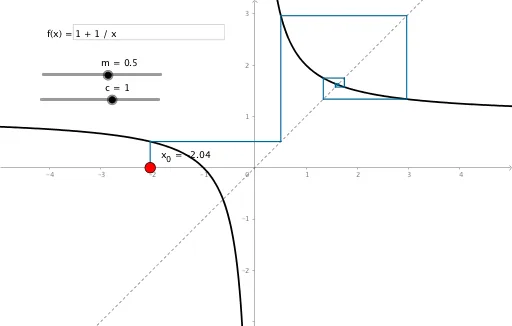
This example demonstrates the concept of fixed points. By analyzing the function graph, we can observe the position of the fixed points. Commands like Point, Textfield, and Segment are used to construct the graph. Suitable for high school mathematics education and learning.
GeoGebra Commands & Parameters
Point(xAxis) → ATextfield(f) → InputBox1Segment(C1, D1) → E1Segment(C2, D2) → E2Segment(C2, D1) → F2Segment(C3, D3) → E3Segment(C3, D2) → F3Segment(C4, D4) → E4Segment(C4, D3) → F4Segment(C5, D5) → E5Segment(C5, D4) → F5Segment(C6, D6) → E6Segment(C6, D5) → F6Segment(C7, D7) → E7Segment(C7, D6) → F7Segment(C8, D8) → E8Segment(C8, D7) → F8Segment(C9, D9) → E9Segment(C9, D8) → F9Segment(C10, D10) → E10Segment(C10, D9) → F10Segment(C11, D11) → E11Segment(C11, D10) → F11Segment(C12, D12) → E12Segment(C12, D11) → F12Segment(A, C1) → g
AI Drawing Prompt Reference
Draw a function graph with a movable point on the x-axis. From this point, construct a series of points on the function curve, connecting each point to its corresponding point on the curve with line segments, forming a staircase-like iteration path that shows convergence. Add an input box next to the graph for entering the function expression. The overall figure illustrates the concept of attracting fixed points, where the iteration sequence approaches a stable point.
The prompt above was compiled from the original drawing commands and is for reference only.