
Comparing Measures of Center: Mean, Median, and RMS
Loading the math board and drawing, please wait…
In collections
Statistics Demonstrations
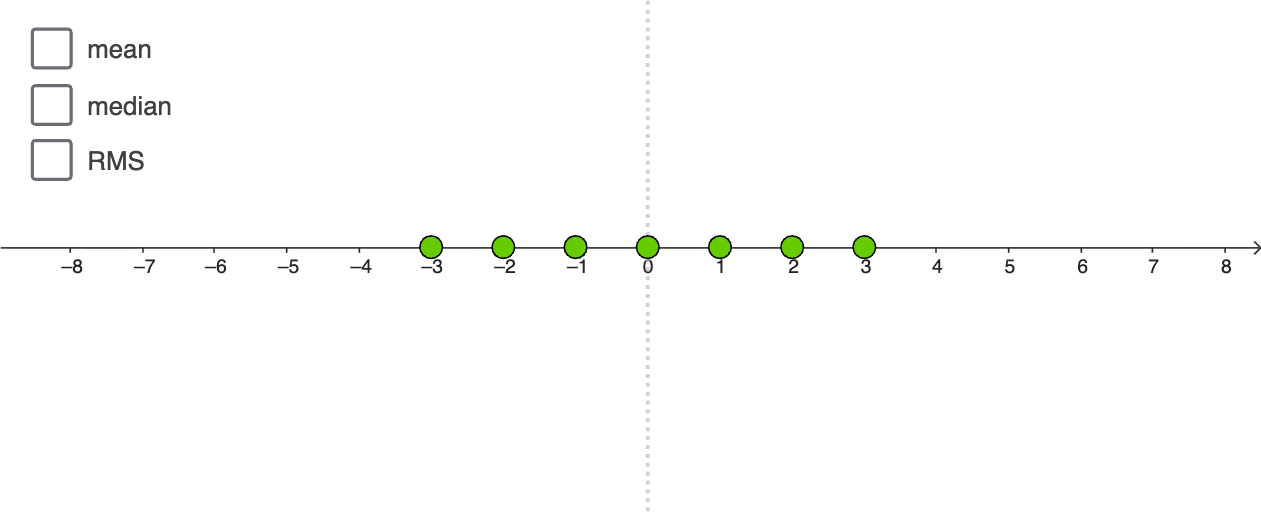
This GeoGebra example demonstrates a visual comparison of different measures of center for a dataset (or sample): the mean, the median, and the root mean square (RMS). It highlights how these statistics act as “center” summaries and how their values can differ depending on the data distribution, connecting to ideas from probability and variability. The main mathematical concepts are measures of central tendency and the construction/interpretation of statistical quantities: arithmetic mean, median, and RMS (sensitive to spread via squared deviations). Construction in GeoGebra uses Point to create the data points and label anchor points (e.g., MeanLabelPt, MedianLabelPt, RMSLabelPt), Median to compute and display the median (median) and its reference line (medianLine), mean to compute and display the arithmetic mean (mean) and mean line (meanLine), RootMeanSquare to compute RMS (rms) and its line (rmsLine). Line is used to draw the reference lines, and Text adds numeric annotations (text1, text2, text3) directly on the diagram. Suitable for high-school advanced math, introductory statistics, and teaching/learning activities focused on intuitive understanding of statistical measures.
GeoGebra Commands & Parameters
Point(xAxis) → APoint(xAxis) → BPoint(xAxis) → CPoint(xAxis) → DPoint(xAxis) → EPoint(xAxis) → FPoint(xAxis) → GMedian(xVals) → medianmean(xVals) → meanRootMeanSquare(xVals) → rmsLine((median, 0), (median, 1)) → medianLineLine((mean, 0), (mean, 1)) → meanLineLine((rms, 0), (rms, 1)) → rmsLineText("mean") → text1Line((0, 0), (0, 1)) → f
AI Drawing Prompt Reference
On a coordinate plane, place seven data points along the horizontal axis at arbitrary positions to represent a sample. For this dataset, compute and draw three vertical reference lines: one for the arithmetic mean, one for the median, and one for the root mean square (RMS). Each line extends upward from the horizontal axis to a height of 1, with its corresponding label (mean, median, RMS) placed near the top. Additionally, draw a vertical baseline on the left as a reference axis. The diagram visually compares the positions of these three measures of center, highlighting how the RMS is more sensitive to spread.
The prompt above was compiled from the original drawing commands and is for reference only.