
Normal Approximation for the Sampling Distribution of a Proportion
Loading the math board and drawing, please wait…
In collections
Statistics Demonstrations
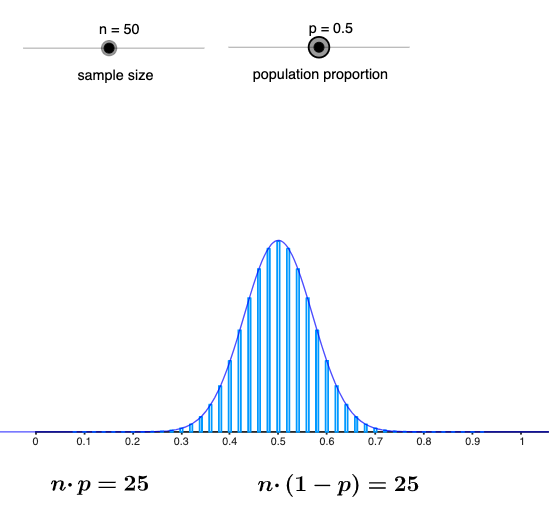
This GeoGebra example visualizes how the sampling distribution of the sample proportion can be approximated by a Normal distribution when parameters n and p are given. It demonstrates the match (and when it may fail) between the discrete Binomial proportion probabilities and a continuous Normal curve using the standard mean np and standard deviation sqrt(npq). The construction uses Sequence to generate the list of possible proportions (propList), binomProb to compute Binomial probabilities at each proportion value, and BarChart to display the discrete probability mass. It then overlays a Normal approximation via Normal together with computed quantities m, sd, np, and nq, producing objects such as norm1/norm2 and propDensity. A fit step (fit) and several text annotations (text1–text6) highlight the approximation conditions and the resulting comparison. Suitable for secondary to early undergraduate courses on probability and statistics, and for classroom demonstrations of the normal approximation to the distribution of proportions.
GeoGebra Commands & Parameters
Sequence(BinomialDist[n, p, k, false], k, 0, n) → binomProbNormal(m, sd, x, false) → fSequence(0, 1, 1 / n) → propListBarChart(propList, propDensity, 1 / ((4 * n))) → propChart
AI Drawing Prompt Reference
Create a chart showing how the sampling distribution of a sample proportion can be approximated by a normal distribution. Generate all possible proportions from 0 to n, calculate binomial probabilities for each proportion, and display them as a bar chart. Then, plot a normal curve based on the standard mean np and standard deviation sqrt(npq), overlaying it on the bar chart. Finally, add text annotations to highlight the approximation conditions and the comparison results.
The prompt above was compiled from the original drawing commands and is for reference only.