
Repeated Coin Flips Simulation and Heads Proportion Plot
Loading the math board and drawing, please wait…
In collections
Statistics Demonstrations
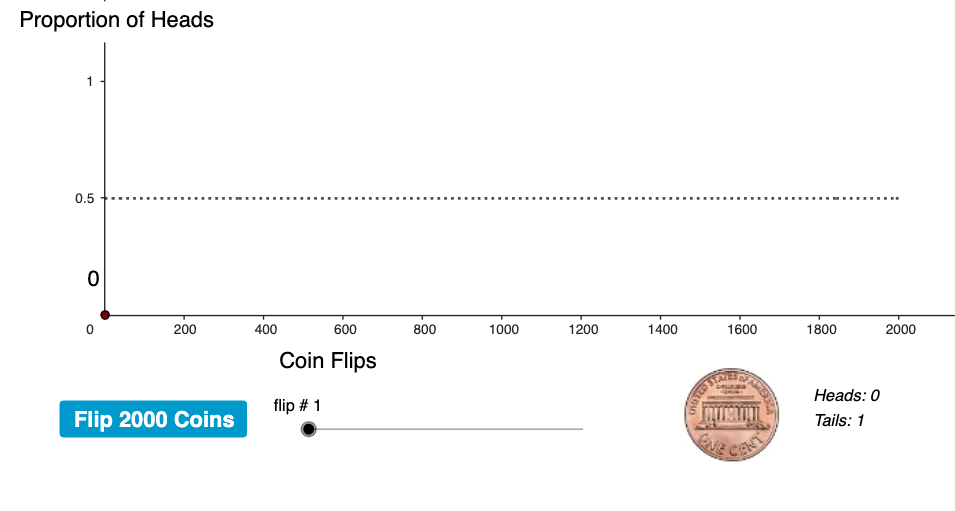
This example simulates repeated coin flips and visualizes how the proportion of heads accumulates and evolves as the number of trials increases, providing an intuitive view of statistical stabilization over time. It centers on probability & statistics ideas such as independent repeated trials, sample proportion (empirical heads frequency), and sequences that update step-by-step with each new flip. The construction uses GeoGebra commands and objects including Sequence to generate the trial index n, and iterative bookkeeping of points and partial results (pts, partialPts, currentPt, currentProp). Element and Text are used to manage variables like numHeads and numTails and to display dynamic readouts (button1, propText, text1/text2/text3). PolyLine builds the evolving chart/trajectory (chart, flips), connecting each incremental proportion to form a time-ordered plot. Suitable for secondary school through early university, especially for demonstrations, exploratory learning, and introductory work with random processes.
GeoGebra Commands & Parameters
Sequence(Element[pts, k], k, 1, n) → partialPtsElement(partialPts, n) → currentPtText(currentProp) → propTextPolyLine(partialPts) → chartText("Heads: " + numHeads + "\\n" + "Tails: " + numTails) → text3
AI Drawing Prompt Reference
Draw a line chart that shows how the proportion of heads increases over time with repeated coin flips. Use a sequence of points to represent the proportion after each trial and connect them with a polyline. Add text labels to display the current number of heads and tails, and the changing proportion. The chart should visually demonstrate how the proportion stabilizes as the number of trials increases.
The prompt above was compiled from the original drawing commands and is for reference only.