
Logistic Fit and Probability Statistics Demonstration
Loading the math board and drawing, please wait…
In collections
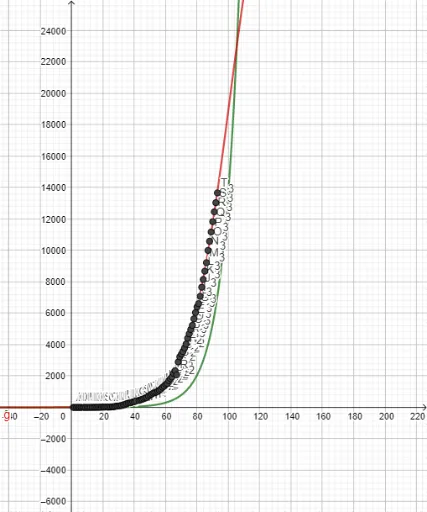
Confirmed Coronavirus Cases in Countries
This example demonstrates how to fit logistic functions to data and visualize probability distributions. Core math concepts include logistic functions, Poisson distribution, random variables, quadrilaterals, and pie/circle charts. It uses the GeoGebra FitLogistic command to fit multiple datasets, creating function f and its parameters A1-B20. Suitable for high school and above students learning about probability statistics and function fitting applications.
GeoGebra Commands & Parameters
FitLogistic(l1) → g