
Probability and Function Fitting in GeoGebra
Loading the math board and drawing, please wait…
In collections
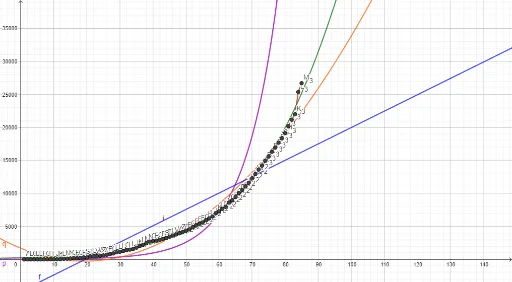
Confirmed Coronavirus Cases in Countries
This example demonstrates how to visualize probability distributions, confidence intervals, and natural number probabilities using GeoGebra. Key mathematical concepts include probability statistics, function fitting, and confidence interval calculations. Construction involves commands like FitLineY, FitLogistic, FitGrowth, FitExp, FitPoly, and PolyLine, along with points A1 to B20. Suitable for high school students or college freshmen learning probability and function graphing.
GeoGebra Commands & Parameters
FitLineY(l1) → fFitLogistic(l1) → gFitGrowth(l1) → hFitExp(l1) → pFitPoly(l1, 2) → qPolyLine(l1) → i
AI Drawing Prompt Reference
Draw a graph showing probability distributions, including a straight line, a logistic growth curve, an exponential growth curve, a polynomial curve, and a polyline. These curves are based on a basic point and fitted using different functions to illustrate probability statistics and function fitting. The construction order starts with the basic point, then fits the straight line, logistic growth, exponential growth, polynomial curve, and finally the polyline to help understand the relationship between probability and function fitting.
The prompt above was compiled from the original drawing commands and is for reference only.