
Pakistan: Matrix Simulation of Stochastic Process and Confidence Intervals
Loading the math board and drawing, please wait…
In collections
Confirmed Coronavirus Cases in Countries
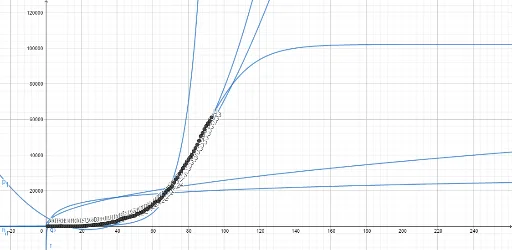
This GeoGebra example demonstrates a stochastic process simulation using 20 paired point objects (A1-A20 and B1-B20), visually representing the distribution of random variable sequences and the formation of confidence intervals. The core mathematical concepts include stochastic processes, conditional probability, confidence intervals, continuity, and matrix operations, where matrices may be used to store or transform random data. The construction involves generating 20 pairs of points via lists or sequences, each pair representing an outcome of a random trial, with point positions reflecting randomness, possibly controlled by sliders or buttons for iteration. This is suitable for high school to university students studying probability, statistics, stochastic processes, or data analysis, helping them understand random simulation, the meaning of confidence intervals, and the application of matrices in data processing.
GeoGebra Commands & Parameters
1222324454657585951051151261361416151916201720182819522053211872224123302244612549526646277842888729991301057
AI Drawing Prompt Reference
Draw a graph with 20 pairs of points, each pair representing a random trial outcome, with positions showing randomness, controlled by sliders for iteration, visualizing the distribution of random variable sequences and confidence intervals, with matrix operations linking the pairs, suitable for probability and statistics education.
The prompt above was compiled from the original drawing commands and is for reference only.