
Histogram Construction Example by caner
Loading the math board and drawing, please wait…
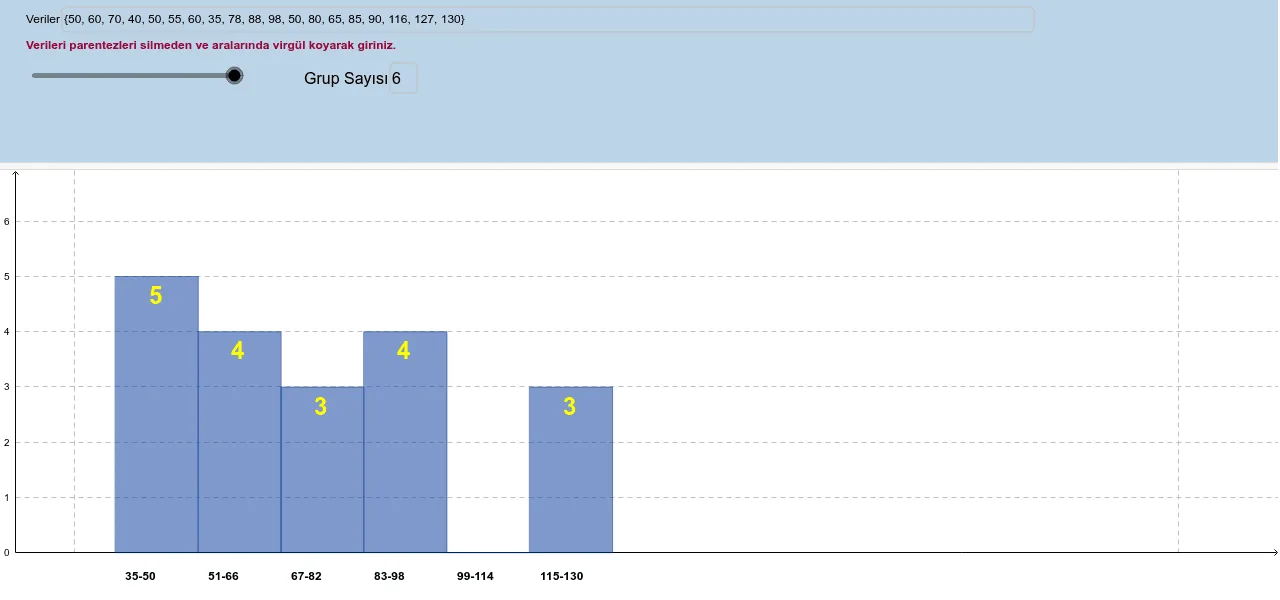
This example demonstrates how to create a histogram using GeoGebra, visually representing data distribution. Core math concepts include Probability & Statistics, Integral Calculus, and Graphing Functions. Key GeoGebra commands and objects used are Sequence, Min, Max, CountIf, and Textfield. Suitable for high school and above students learning data analysis, statistical graphing, and the geometric interpretation of integrals in calculus.
GeoGebra Commands & Parameters
Sequence(((a * i) - (a * 0.5), 0), i, 1, B2) → liste2Sequence(((a * i) + (a * 0.5), 0), i, 1, B2) → liste3Sequence((x(Element[liste2, i]) + x(Element[liste3, i])) / 2, i, 1, B2) → liste12Min(liste1) → B6Max(liste1) → B5CountIf(M15 ≤ x ≤ M16, liste1) → M18CountIf(L15 ≤ x ≤ L16, liste1) → L18CountIf(K15 ≤ x ≤ K16, liste1) → K18CountIf(J15 ≤ x ≤ J16, liste1) → J18CountIf(I15 ≤ x ≤ I16, liste1) → I18CountIf(H15 ≤ x ≤ H16, liste1) → H18CountIf(G15 ≤ x ≤ G16, liste1) → G18CountIf(F15 ≤ x ≤ F16, liste1) → F18CountIf(E15 ≤ x ≤ E16, liste1) → E18CountIf(D15 ≤ x ≤ D16, liste1) → D18CountIf(C15 ≤ x ≤ C16, liste1) → C18CountIf(B15 ≤ x ≤ B16, liste1) → B18Sequence(((a * i) + (a * 0.5), Element[liste4, i]), i, 1, B2) → liste6Sequence(((a * i) - (a * 0.5), Element[liste4, i]), i, 1, B2) → liste5Sequence((x(Element[liste5, i]) + x(Element[liste6, i])) / 2, i, 1, B2) → liste11Sequence(y(Element[liste6, i]) - 0.5, i, 1, B2) → liste10Sequence(Polygon[Element[liste2, i], Element[liste3, i], Element[liste6, i], Element[liste5, i]], i, 1, B2) → liste7Textfield(B2) → MetinAlanı1Sequence((Element[liste12, i] - (a * 0.38), (-0.5)), i, 1, B2) → liste8Sequence((Element[liste11, i] - (a * 0.1), Element[liste10, i]), i, 1, B2) → liste9Textfield(B2) → MetinAlanı1_1Textfield(liste1) → Veriler
AI Drawing Prompt Reference
Create a histogram to visualize data distribution by generating two symmetric sequences of x-axis points, calculating their midpoints to form a new x-axis sequence, counting data points within multiple intervals, and connecting the midpoints with rectangles to represent the counts. Label the dataset and histogram.
The prompt above was compiled from the original drawing commands and is for reference only.