
Sample Means
Loading the math board and drawing, please wait…
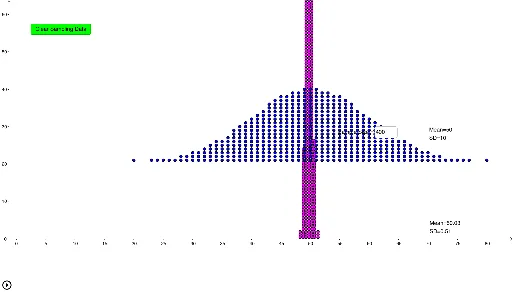
This example demonstrates the distribution and calculation of sample means. It involves core mathematical concepts like sample mean, step functions, differential equations, multiplication, secant lines, and expected value. The construction uses GeoGebra commands such as Sequence, mean, Textfield, DotPlot, and Translate. It is suitable for high school and above, particularly in probability & statistics and calculus introductory lessons.
GeoGebra Commands & Parameters
Sequence(RandomElement[datatags], a, 1, n) → list1mean(list1) → aTextfield(n) → inputBox1DotPlot(data, true, 1) → list2Translate(DotPlot[datatags], (0, 20)) → list3
AI Drawing Prompt Reference
Demonstrate the distribution and calculation of sample means with a sequence of random data points, represented as a dot plot, and calculate the sample mean. Translate the dot plot along the y-axis, displaying the sample size and mean, suitable for high school and above in probability & statistics and calculus introductory lessons.
The prompt above was compiled from the original drawing commands and is for reference only.