
Water Evaporation Percentage
Loading the math board and drawing, please wait…
In collections
Chemistry2
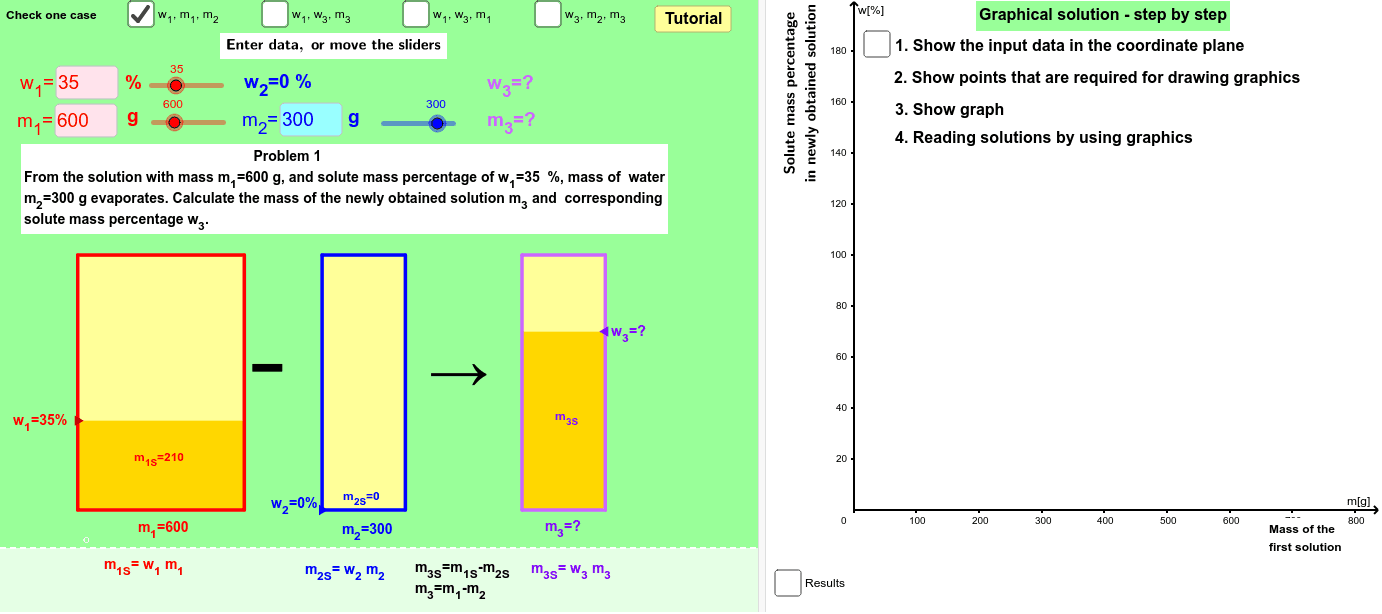
This example demonstrates the dynamic changes in water evaporation percentage using linear and power functions, pie charts, and analytical geometry. It involves core math concepts like calculus and probability statistics. Constructed with GeoGebra commands such as Line, OrthogonalLine, Intersect, Ray, etc., it is suitable for high school and above mathematics education and data analysis beginners.
GeoGebra Commands & Parameters
Line(A_2, C_2) → pOrthogonalLine(G_2, f_1) → qIntersect(q, p) → B_2Ray(A_4, B_4) → lOrthogonalLine(E_4, j_1) → mIntersect(l, m) → C_4Line(A_3, B_3) → fIntersect(c, f) → C_3Textfield(m_11) → inputBoxm_11Textfield(m_21) → inputBoxm_21Textfield(w_11) → inputBoxw_11Textfield(m_32) → inputBoxm_32Line(A_1, C_1) → bIntersect(a, b) → B_1Segment(E_1, C_1) → b_1Segment(C_1, F_1) → c_1Segment(D_1, B_1) → a_1Segment(B_1, G_1) → d_1Segment(G_2, B_2) → d_2Segment(B_2, D_2) → a_2Segment(C_2, E_2) → b_2Segment(C_2, F_2) → c_2Segment(G_3, B_3) → d_3Segment(D_3, B_3) → a_3Line(B_4, C_4) → iSegment(G_4, B_4) → d_4Segment(B_4, D_4) → a_4Segment(F_4, C_4) → c_4Segment(C_4, E_4) → b_4Midpoint(D_2, E_2) → S_2Midpoint(D_4, E_4) → S_4Textfield(w_12) → inputBoxw_12Textfield(w_13) → inputBoxw_13Textfield(w_33) → inputBoxw_33Textfield(m_13) → inputBoxm_13Textfield(w_32) → inputBoxw_32Textfield(w_34) → inputBoxw_34Textfield(m_34) → inputBoxm_34Midpoint(D_1, E_1) → S_1VerticalText(Oy) → OyvVerticalText(text2) → text3Min(w_13, w_23) → min3Max(w_13, w_23) → max3Sequence((100 * n), n, 0, 200) → list1KeepIf(0 < x ≤ 100, list21) → list31Element(list31, 1) → elem1IndexOf(elem1, list21) → index1Element(list1, index1) → scalePolygon(H_1, I_1, M_1, L_1) → poly1z1, a_5, b_5, c_5, d_5Polygon(H_1, I_1, J_1, K_1) → poly1b1, d, e, j, kMidpoint(D_3, E_3) → S_3Ray(F_3, C_3) → hPolygon(N_1, O_1, T_1, R_1) → poly1z2, n_1, o_1, t_5, r_5Polygon(N_1, O_1, P_1, Q_1) → poly1b2, n_2, o_2, p_5, q_5Polygon(U_1, V_1, W_1, X_1) → poly1b3, u_5, v_1, w_1, x_1Polygon(U_1, V_1, Z_1, Y_1) → poly1z3, u_6, v_2, z_1, y_1Segment(F_3, C_3) → c_3Segment(C_3, E_3) → b_3Polygon(H_2, I_2, J_2, K_2) → poly2b1, h_2, i_2, j_2, k_5Polygon(N_2, O_2, P_2, Q_2) → poly2b2, n_3, o_3, p_6, q_6Polygon(U_2, V_2, W_2, X_2) → poly2b3, u_7, v_3, w_2, x_2Polygon(H_2, I_2, M_2, L_2) → poly2z1, h_1, i_1, m_2, l_2Polygon(N_2, O_2, T_2, R_2) → poly2z2, n_4, o_4, t_6, r_6Polygon(U_2, V_2, Z_2, Y_2) → poly2z3, u_8, v_4, z_2, y_2Polygon(H_3, I_3, J_3, K_3) → poly3b1, h_3, i_3, j_3, k_6Polygon(N_3, O_3, P_3, Q_3) → poly3b2, n_5, o_5, p_7, q_7Polygon(U_3, V_3, W_3, X_3) → poly3b3, u_9, v_5, w_3, x_3Polygon(H_3, I_3, M_3, L_3) → poly3z1, h_4, i_4, m_1, l_3Polygon(N_3, O_3, T_3, R_3) → poly3z2, n_6, o_6, t_7, r_7Polygon(Y_3, U_3, V_3, Z_3) → poly3z3, y_3, u_{10}, v_6, z_3Polygon(H_4, I_4, J_4, K_4) → poly4b1, h_5, i_5, j_4, k_7Polygon(N_4, O_4, P_4, Q_4) → poly4b2, n_7, o_7, p_8, q_8Polygon(U_4, V_4, W_4, X_4) → poly4b3, u_{11}, v_7, w_4, x_4Polygon(H_4, I_4, M_4, L_4) → poly4z1, h_6, i_6, m_4, l_4Polygon(N_4, O_4, T_4, R_4) → poly4z2, n_8, o_8, t_8, r_8Polygon(U_4, V_4, Z_4, Y_4) → poly4z3, u_{12}, v_8, z_4, y_4Textfield(m_24) → inputBoxm_24Ray(E_4, C_4) → nSegment(A_1, B_1) → g_1Ray(D_1, B_1) → tSegment(A_2, B_2) → g_2Ray(G_2, B_2) → e_1Segment(A_3, B_3) → g_3Segment(A_4, B_4) → g_4OrthogonalLine(F_2, f_1) → g
AI Drawing Prompt Reference
Create a dynamic graph demonstrating water evaporation percentage using linear and power functions, pie charts, and analytical geometry. Start by drawing two intersecting line segments to determine a point, then create a ray and a perpendicular line from this point. Find the intersection of the ray and the perpendicular line, and let it intersect another line segment to get a new point. Draw multiple line segments connecting these points to form a complex geometric structure. Add text boxes to input parameters and use them to calculate and display data. Finally, adjust the size of graph elements based on the calculated results to show changes in water evaporation percentage.
The prompt above was compiled from the original drawing commands and is for reference only.