
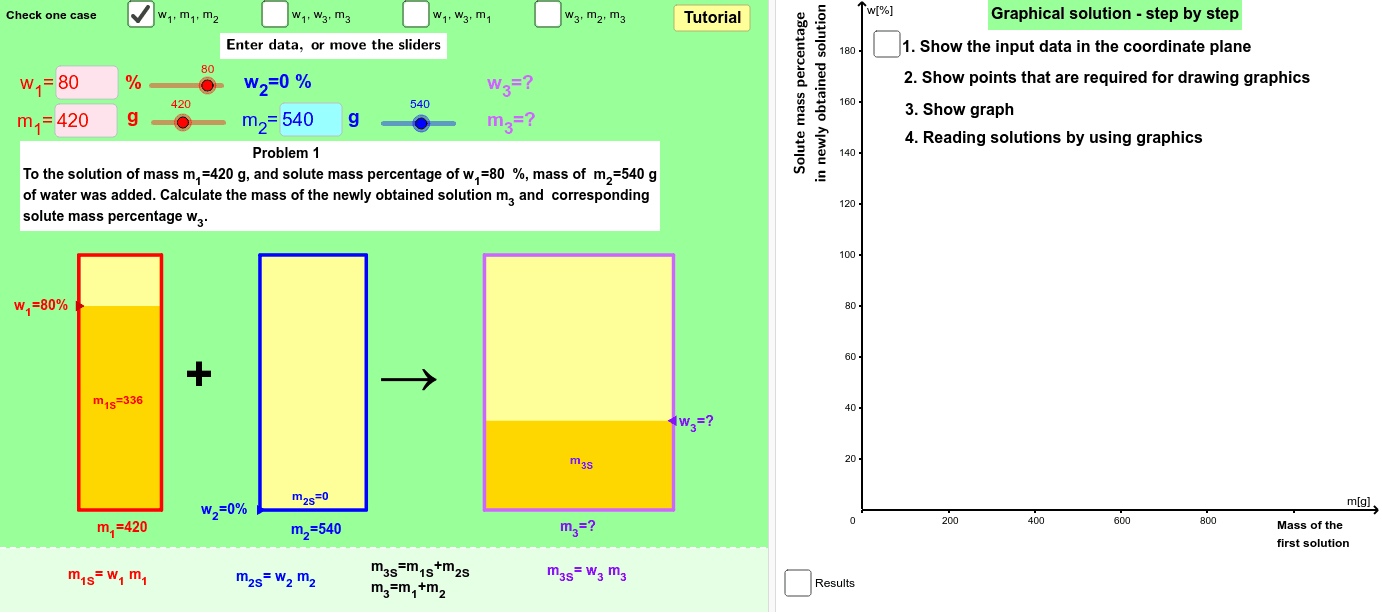
Mixing Problem: Calculating Water Addition Percentage
Loading the math board and drawing, please wait…
In collections
Chemistry2
This example demonstrates how to calculate the concentration percentage after adding water to an original solution. The core mathematical concept is the application of linear functions in concentration problems, using the principle of solute mass conservation to establish equations and solve for the new percentage concentration after dilution. Construction highlights: Use GeoGebra's Textfield for inputting initial concentration and water amount, apply LinearFunction to calculate new concentration, and use Sliders to dynamically show concentration changes with varying water additions. This example is suitable for middle school mathematics courses teaching equations, functions, and practical applications of percentages, as well as demonstrating proportional concepts in probability and statistics.
GeoGebra Commands & Parameters
Ray(A_4, B_4) → lOrthogonalLine(E_4, e_1) → mIntersect(l, m) → C_4Line(A_3, B_3) → fLine(A_2, C_2) → pIntersect(c, f) → C_3Textfield(m_11) → inputBoxm_11Textfield(m_21) → inputBoxm_21Textfield(w_11) → inputBoxw_11Textfield(m_32) → inputBoxm_32Line(A_1, C_1) → bIntersect(a, b) → B_1Segment(E_1, C_1) → b_1Segment(C_1, F_1) → c_1Segment(D_1, B_1) → a_1Segment(B_1, G_1) → d_1Segment(A_1, C_1) → g_1OrthogonalLine(G_2, t) → qIntersect(q, p) → B_2Segment(A_2, C_2) → g_2Segment(G_2, B_2) → d_2Segment(B_2, D_2) → a_2Segment(C_2, E_2) → b_2Segment(C_2, F_2) → c_2Segment(G_3, B_3) → d_3Segment(D_3, B_3) → a_3Line(B_4, C_4) → iSegment(G_4, B_4) → d_4Segment(B_4, D_4) → a_4Segment(F_4, C_4) → c_4Segment(C_4, E_4) → b_4Segment(A_4, C_4) → g_4Midpoint(D_2, E_2) → S_2Midpoint(D_4, E_4) → S_4Textfield(w_12) → inputBoxw_12Textfield(w_13) → inputBoxw_13Textfield(w_33) → inputBoxw_33Textfield(m_13) → inputBoxm_13Textfield(w_32) → inputBoxw_32Textfield(w_34) → inputBoxw_34Textfield(m_34) → inputBoxm_34Midpoint(D_1, E_1) → S_1VerticalText(Oy) → OyvVerticalText(text2) → text3Min(w_13, w_23) → min3Max(w_13, w_23) → max3Sequence((100 * n), n, 0, 200) → list1KeepIf(0 < x ≤ 100, list21) → list31Element(list31, 1) → elem1IndexOf(elem1, list21) → index1Element(list1, index1) → scalePolygon(H_1, I_1, M_1, L_1) → poly1z1, a_5, b_5, c_5, d_5Polygon(H_1, I_1, J_1, K_1) → poly1b1, d, e, j, kMidpoint(D_3, E_3) → S_3Ray(F_3, C_3) → hSegment(A_3, C_3) → g_3Polygon(N_1, O_1, T_1, R_1) → poly1z2, n_1, o_1, t_5, r_5Polygon(N_1, O_1, P_1, Q_1) → poly1b2, n_2, o_2, p_5, q_5Polygon(U_1, V_1, W_1, X_1) → poly1b3, u_5, v_1, w_1, x_1Polygon(U_1, V_1, Z_1, Y_1) → poly1z3, u_6, v_2, z_1, y_1Segment(F_3, C_3) → c_3Segment(C_3, E_3) → b_3Polygon(H_2, I_2, J_2, K_2) → poly2b1, h_2, i_2, j_2, k_5Polygon(N_2, O_2, P_2, Q_2) → poly2b2, n_3, o_3, p_6, q_6Polygon(U_2, V_2, W_2, X_2) → poly2b3, u_7, v_3, w_2, x_2Polygon(H_2, I_2, M_2, L_2) → poly2z1, h_1, i_1, m_2, l_2Polygon(N_2, O_2, T_2, R_2) → poly2z2, n_4, o_4, t_6, r_6Polygon(U_2, V_2, Z_2, Y_2) → poly2z3, u_8, v_4, z_2, y_2Polygon(H_3, I_3, J_3, K_3) → poly3b1, h_3, i_3, j_3, k_6Polygon(N_3, O_3, P_3, Q_3) → poly3b2, n_5, o_5, p_7, q_7Polygon(U_3, V_3, W_3, X_3) → poly3b3, u_9, v_5, w_3, x_3Polygon(H_3, I_3, M_3, L_3) → poly3z1, h_4, i_4, m_1, l_3Polygon(N_3, O_3, T_3, R_3) → poly3z2, n_6, o_6, t_7, r_7Polygon(Y_3, U_3, V_3, Z_3) → poly3z3, y_3, u_{10}, v_6, z_3Polygon(H_4, I_4, J_4, K_4) → poly4b1, h_5, i_5, j_4, k_7Polygon(N_4, O_4, P_4, Q_4) → poly4b2, n_7, o_7, p_8, q_8Polygon(U_4, V_4, W_4, X_4) → poly4b3, u_{11}, v_7, w_4, x_4Polygon(H_4, I_4, M_4, L_4) → poly4z1, h_6, i_6, m_4, l_4Polygon(N_4, O_4, T_4, R_4) → poly4z2, n_8, o_8, t_8, r_8Polygon(U_4, V_4, Z_4, Y_4) → poly4z3, u_{12}, v_8, z_4, y_4Textfield(m_24) → inputBoxm_24Ray(E_4, C_4) → nOrthogonalLine(F_2, t) → g
AI Drawing Prompt Reference
Draw a diagram to illustrate how to calculate the concentration percentage after adding water to an original solution. Include a line and a perpendicular line intersecting at point C. Another line intersects the first line at C. Use text fields for inputting initial concentration and water amount, and apply a linear function to calculate the new concentration. Use sliders to dynamically show concentration changes with varying water additions. The diagram also features multiple line segments and several midpoints to represent the geometric changes in concentration.
The prompt above was compiled from the original drawing commands and is for reference only.