
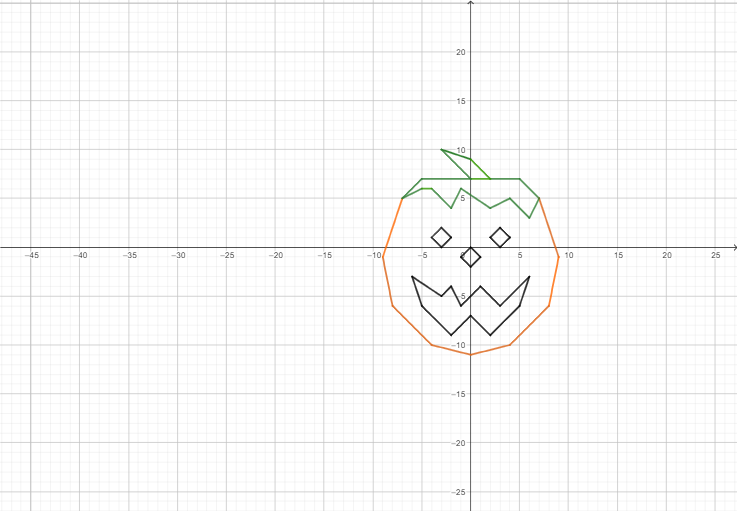
Pumpkin Night: Visualizing Random Experiments and Normal Distribution
Loading the math board and drawing, please wait…
In collections
Function Arts
① This example, titled 'Pumpkin Night', demonstrates a playful visualization of random experiments, normal distribution, circles, squares, and linear programming concepts. ② Core mathematical concepts include the normal distribution, random experiments, geometric relationships between circles and squares, and linear programming/optimization with feasible regions and objective functions. ③ Construction highlights: based on the summary, numerous objects (f, g, c, d, e, h, a, b, i, j, k, l, m, n, o, q, r, r1, s, t, u, v, w, z1, a1~p1) are used, involving circles, squares, normal distribution curves, random point generation, and linear constraint regions, likely driven by sliders or random numbers for dynamic effects. ④ Suitable for high school to early college students, this example helps understand probability and statistics (normal distribution, random simulation) and linear programming (feasible regions and optimal solutions) through interactive visualization, ideal for math labs or inquiry-based learning.
GeoGebra Commands & Parameters
f(x) = If[-3 ≤ x ≤ 0, (-1 / 3 * x) + 9]g(x) = If[0 ≤ x ≤ 2, (-x) + 9]c(x) = If[2 ≤ x ≤ 5, (-0 / 1 * x) + 7 / 1]d(x) = If[5 ≤ x ≤ 7, (-x) + 12]e(x) = If[7 ≤ x ≤ 9, (-3 * x) + 26]h(x) = If[0 ≤ x ≤ 4, (1 / 4 * x) - 11]a(x) = If[8 ≤ x ≤ 9, (5 * x) - 46]b(x) = If[4 ≤ x ≤ 8, x - 14]i(x) = If[-4 ≤ x ≤ 0, ((-(1 / 4)) * x) - 11]j(x) = If[-8 ≤ x ≤ -4, (-x) - 14]k(x) = If[-9 ≤ x ≤ -8, (-5 * x) - 46]l(x) = If[-9 ≤ x ≤ -7, (3 * x) + 26]m(x) = If[-7 ≤ x ≤ -5, x + 12]n(x) = If[0 ≤ x ≤ 2, ((-(0 / 1)) * x) + 7 / 1]o(x) = If[-3 ≤ x ≤ 0, (-x) + 7]q(x) = If[-5 ≤ x ≤ 0, ((-(0 / 1)) * x) + 7 / 1]r(x) = If[-7 ≤ x ≤ -5, (1 / 2 * x) + 8.5]r1(x) = If[3 ≤ x ≤ 6, x - 9]s(x) = If[-4 ≤ x ≤ -2, (-x) + 2]t(x) = If[-2 ≤ x ≤ -1, (2 * x) + 8]u(x) = If[-1 ≤ x ≤ 2, (-2 / 3 * x) + 5.34]v(x) = If[2 ≤ x ≤ 4, (1 / 2 * x) + 3]w(x) = If[4 ≤ x ≤ 6, (-x) + 9]z_{1}(x) = If[6 ≤ x ≤ 7, (2 * x) - 9]a1(x) = If[-3 ≤ x ≤ -2, (-x) - 1]b1(x) = If[-3 ≤ x ≤ -2, x + 3]c1(x) = If[-4 ≤ x ≤ -3, (-x) - 3]d1(x) = If[-4 ≤ x ≤ -3, x + 5]e1(x) = If[3 ≤ x ≤ 4, (-x) + 5]f1(x) = If[3 ≤ x ≤ 4, x - 3]g1(x) = If[2 ≤ x ≤ 3, (-x) + 3]h1(x) = If[2 ≤ x ≤ 3, x - 1]i1(x) = If[0 ≤ x ≤ 1, (-x)]j1(x) = If[0 ≤ x ≤ 1, x - 2]k1(x) = If[-1 ≤ x ≤ 0, (-x) - 2]l1(x) = If[-1 ≤ x ≤ 0, x]m1(x) = If[-6 ≤ x ≤ -3, (-2 / 3 * x) - 7]n1(x) = If[-3 ≤ x ≤ -2, x - 2]o1(x) = If[-2 ≤ x ≤ -1, (-2 * x) - 8]p1(x) = If[-1 ≤ x ≤ 1, x - 5]q1(x) = If[1 ≤ x ≤ 3, (-x) - 3]s1(x) = If[5 ≤ x ≤ 6, (3 * x) - 21]t1(x) = If[2 ≤ x ≤ 5, x - 11]u1(x) = If[0 ≤ x ≤ 2, (-x) - 7]z1(x) = If[-6 ≤ x ≤ -5, (-3 * x) - 21]w1(x) = If[-5 ≤ x ≤ -2, (-x) - 11]v1(x) = If[-2 ≤ x ≤ 0, x - 7]r2(x) = If[-5 ≤ x ≤ -4, ((-(0 / 1)) * x) + 6 / 1]
AI Drawing Prompt Reference
Create a complex graph with multiple piecewise linear functions, each having different expressions over specific intervals, forming a zigzag pattern. Include several circles and squares, demonstrating geometric relationships. Overlay a normal distribution curve and simulate random experiments with scattered points. Highlight linear programming concepts using feasible regions defined by linear constraints and an objective function, all elements should be dynamic for interactive learning.
The prompt above was compiled from the original drawing commands and is for reference only.