
Mixing Problem and Percentage Calculation: Geometric and Function Integration
Loading the math board and drawing, please wait…
In collections
Chemistry2
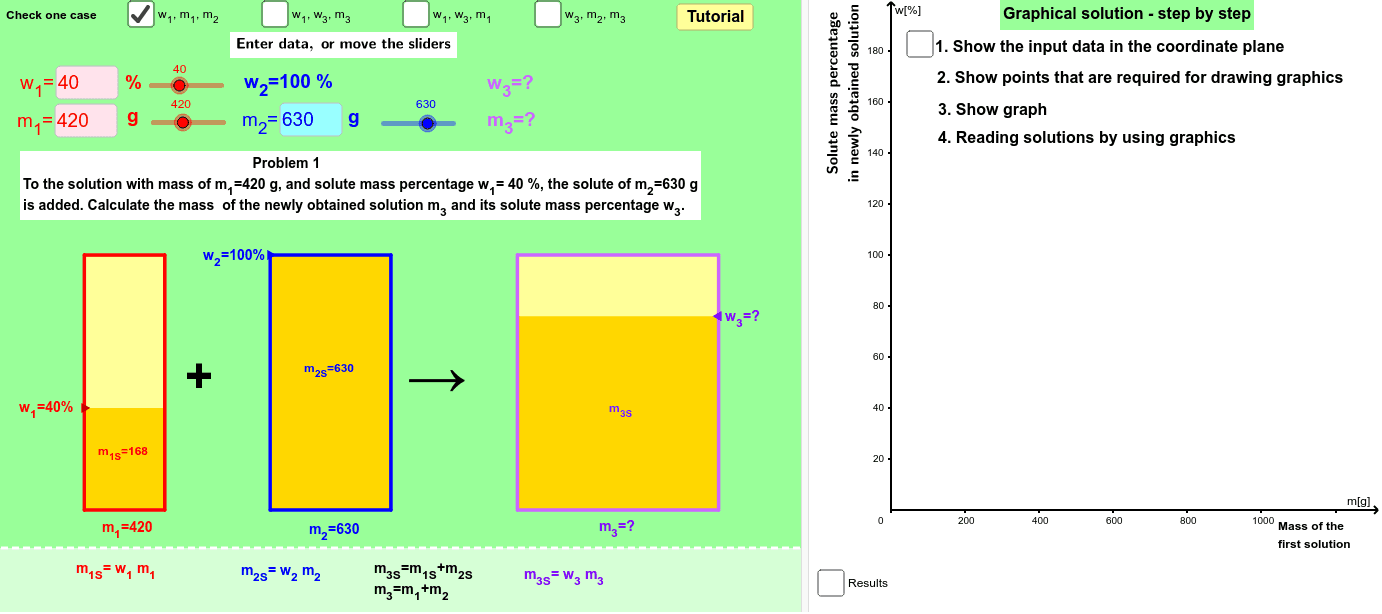
This example demonstrates the relationship between solute addition and percentage calculation through geometric and function graphs. Key mathematical concepts include linear functions, geometric construction, and probability statistics. Construction involves GeoGebra commands like Ray, OrthogonalLine, Intersect, and tools such as Min, Max, Sequence. Suitable for middle school students learning geometric function applications or for math teaching visualization.
GeoGebra Commands & Parameters
Ray(A_4, B_4) → lOrthogonalLine(E_4, e_1) → mIntersect(l, m) → C_4Line(A_3, B_3) → fLine(A_2, C_2) → pIntersect(c, f) → C_3Textfield(m_11) → inputBoxm_11Textfield(m_21) → inputBoxm_21Textfield(w_11) → inputBoxw_11Textfield(m_32) → inputBoxm_32Line(A_1, C_1) → bIntersect(a, b) → B_1Segment(E_1, C_1) → b_1Segment(C_1, F_1) → c_1Segment(D_1, B_1) → a_1Segment(B_1, G_1) → d_1Segment(A_1, C_1) → g_1OrthogonalLine(G_2, t) → qIntersect(q, p) → B_2Segment(A_2, C_2) → g_2Segment(G_2, B_2) → d_2Segment(B_2, D_2) → a_2Segment(C_2, E_2) → b_2Segment(C_2, F_2) → c_2Segment(G_3, B_3) → d_3Segment(D_3, B_3) → a_3Line(B_4, C_4) → iSegment(G_4, B_4) → d_4Segment(B_4, D_4) → a_4Segment(F_4, C_4) → c_4Segment(C_4, E_4) → b_4Segment(A_4, C_4) → g_4Midpoint(D_2, E_2) → S_2Midpoint(D_4, E_4) → S_4Textfield(w_12) → inputBoxw_12Textfield(w_13) → inputBoxw_13Textfield(w_33) → inputBoxw_33Textfield(m_13) → inputBoxm_13Textfield(w_32) → inputBoxw_32Textfield(w_34) → inputBoxw_34Textfield(m_34) → inputBoxm_34Midpoint(D_1, E_1) → S_1VerticalText(Oy) → OyvVerticalText(text2) → text3Min(w_13, w_23) → min3Max(w_13, w_23) → max3Sequence((100 * n), n, 0, 200) → list1KeepIf(0 < x ≤ 100, list21) → list31Element(list31, 1) → elem1IndexOf(elem1, list21) → index1Element(list1, index1) → scalePolygon(H_1, I_1, M_1, L_1) → poly1z1, a_5, b_5, c_5, d_5Polygon(H_1, I_1, J_1, K_1) → poly1b1, d, e, j, kMidpoint(D_3, E_3) → S_3Ray(F_3, C_3) → hSegment(A_3, C_3) → g_3Polygon(N_1, O_1, T_1, R_1) → poly1z2, n_1, o_1, t_5, r_5Polygon(N_1, O_1, P_1, Q_1) → poly1b2, n_2, o_2, p_5, q_5Polygon(U_1, V_1, W_1, X_1) → poly1b3, u_5, v_1, w_1, x_1Polygon(U_1, V_1, Z_1, Y_1) → poly1z3, u_6, v_2, z_1, y_1Segment(F_3, C_3) → c_3Segment(C_3, E_3) → b_3Polygon(H_2, I_2, J_2, K_2) → poly2b1, h_2, i_2, j_2, k_5Polygon(N_2, O_2, P_2, Q_2) → poly2b2, n_3, o_3, p_6, q_6Polygon(U_2, V_2, W_2, X_2) → poly2b3, u_7, v_3, w_2, x_2Polygon(H_2, I_2, M_2, L_2) → poly2z1, h_1, i_1, m_2, l_2Polygon(N_2, O_2, T_2, R_2) → poly2z2, n_4, o_4, t_6, r_6Polygon(U_2, V_2, Z_2, Y_2) → poly2z3, u_8, v_4, z_2, y_2Polygon(H_3, I_3, J_3, K_3) → poly3b1, h_3, i_3, j_3, k_6Polygon(N_3, O_3, P_3, Q_3) → poly3b2, n_5, o_5, p_7, q_7Polygon(U_3, V_3, W_3, X_3) → poly3b3, u_9, v_5, w_3, x_3Polygon(H_3, I_3, M_3, L_3) → poly3z1, h_4, i_4, m_1, l_3Polygon(N_3, O_3, T_3, R_3) → poly3z2, n_6, o_6, t_7, r_7Polygon(Y_3, U_3, V_3, Z_3) → poly3z3, y_3, u_{10}, v_6, z_3Polygon(H_4, I_4, J_4, K_4) → poly4b1, h_5, i_5, j_4, k_7Polygon(N_4, O_4, P_4, Q_4) → poly4b2, n_7, o_7, p_8, q_8Polygon(U_4, V_4, W_4, X_4) → poly4b3, u_{11}, v_7, w_4, x_4Polygon(H_4, I_4, M_4, L_4) → poly4z1, h_6, i_6, m_4, l_4Polygon(N_4, O_4, T_4, R_4) → poly4z2, n_8, o_8, t_8, r_8Polygon(U_4, V_4, Z_4, Y_4) → poly4z3, u_{12}, v_8, z_4, y_4Textfield(m_24) → inputBoxm_24Ray(E_4, C_4) → nOrthogonalLine(F_2, t) → g
AI Drawing Prompt Reference
Create a comprehensive geometric diagram illustrating a mixing problem and percentage calculation. The figure includes several triangles, each formed by vertices, edges, and perpendicular lines, with some triangles connected through intersections of rays and perpendiculars. Multiple input boxes are placed for entering values like mass and percentage, with corresponding results displayed. Additionally, a line intersects a curve at a point, and a perpendicular line meets another line. Midpoints are marked, and vertical text labels are included. The overall layout integrates geometric constructions with function graphs to demonstrate mathematical relationships.
The prompt above was compiled from the original drawing commands and is for reference only.