
Parabola Activity
Loading the math board and drawing, please wait…
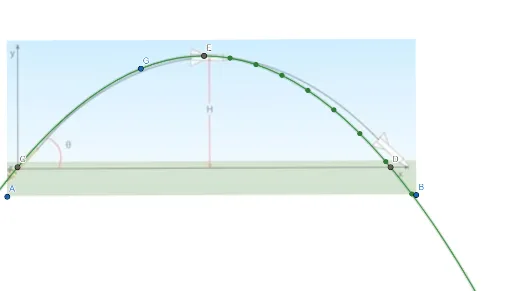
This example demonstrates the plotting and analysis of parabolas, involving key mathematical concepts such as parabola, function graphing, extrema, intersections, and normal distribution. Construction highlights include using GeoGebra commands like Root (root finding), Extremum (finding extrema), Intersect (intersection points), and Point (creating points), with objects A, B, pic1, c, C, D, E, F, G. Suitable for high school mathematics education to understand parabola properties and analytical geometry methods.
GeoGebra Commands & Parameters
Root(c) → C, DExtremum(c) → EIntersect(c, yAxis) → F,Point(c) → G
AI Drawing Prompt Reference
Draw a parabola and label its intersections with the y-axis, vertex, and roots, while also showing a normal line passing through the vertex. Mark several key points on the parabola to illustrate concepts of function graphing, coordinate geometry, calculus, and probability distribution.
The prompt above was compiled from the original drawing commands and is for reference only.