
Compare Normal & Binomial Distributions
Loading the math board and drawing, please wait…
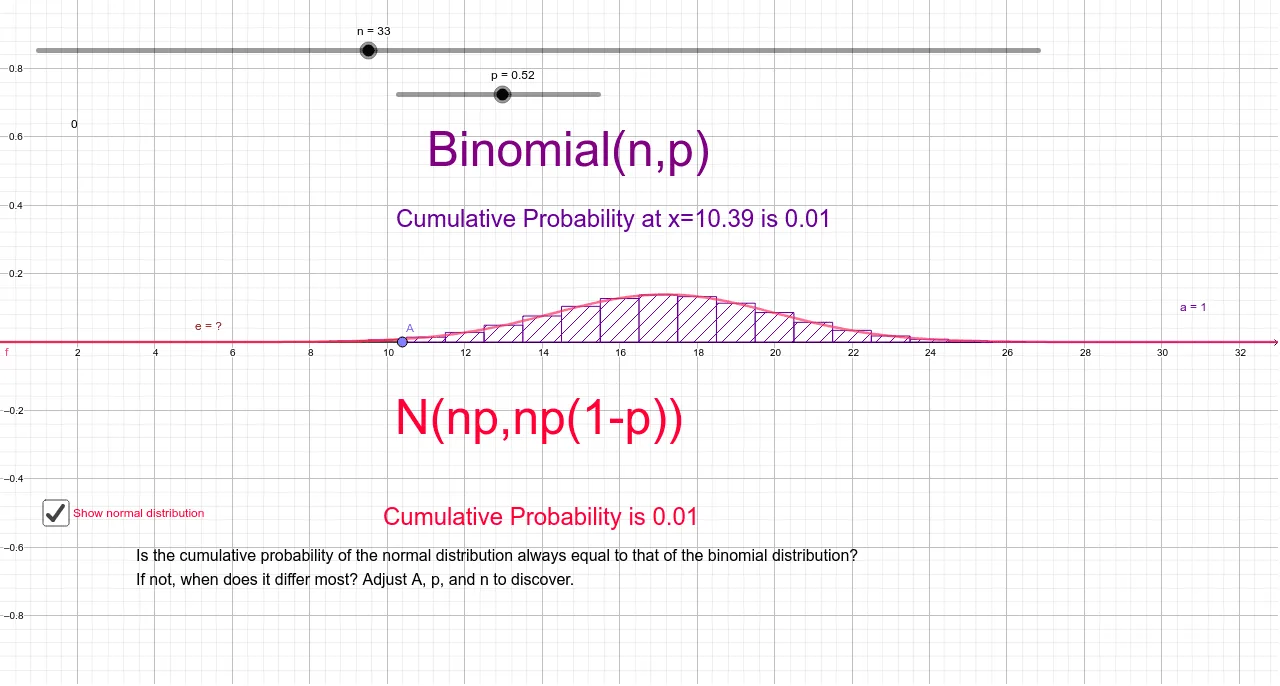
This example demonstrates the graphical comparison between Normal and Binomial distributions. Key math concepts include probability & statistics, distribution functions, binomial coefficients, and integration. GeoGebra commands used are Normal for normal distribution, nCr for binomial coefficients, BinomialDist for binomial distribution, Point for creating points, and Integral for calculating integrals. Suitable for high school and above students to learn and understand the characteristics and applications of different probability distributions.
GeoGebra Commands & Parameters
Normal((n * p), sqrt((n * (p * (1 - p)))), x, false) → fnCr(n, p) → dBinomialDist(n, p, false) → aPoint(xAxis) → ABinomialDist(n, p, x(A), true) → bBinomialDist(n, p, 1…(x(A))) → cIntegral(f, 0, x(A), false) → e
AI Drawing Prompt Reference
Draw a comparison between a normal distribution and a binomial distribution. First, plot the normal distribution curve with parameters np and sqrt(n*p*(1-p)), ranging from 0 to x(A). Then, calculate and plot the binomial probability mass function from 0 to x(A). Finally, calculate and plot the area under the normal distribution curve from 0 to x(A).
The prompt above was compiled from the original drawing commands and is for reference only.