
Visualize Mean and Median
Loading the math board and drawing, please wait…
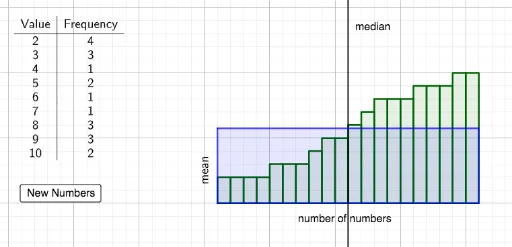
This example demonstrates how to visualize the mean and median of randomly generated data sets using GeoGebra. It involves core math concepts like Arithmetic Mean, Median Value, and Statistics. Key GeoGebra commands used include FrequencyTable, Unique, mean, Polygon, Sequence, and RotateText. Suitable for high school mathematics education to help students intuitively understand the characteristics of mean and median in data sets.
GeoGebra Commands & Parameters
FrequencyTable(Numbers) → text1Unique(Numbers) → Listmean(Numbers) → MeanPolygon(A, C, D, B) → q1, a_1, c, d, bSequence(Polygon[{(n, 0), (n + 1, 0), (n + 1, Numbers(n)), (n, Numbers(n))}], n, 1, Length[Numbers]) → L_1RotateText("mean", 90°) → text2
AI Drawing Prompt Reference
Create a visualization of a random dataset showing its mean and median. Represent each data point as a vertical bar in a sequence of adjacent rectangles, with heights proportional to the values. Mark the arithmetic mean with a horizontal line or point, labeled with rotated vertical text saying 'mean'. Also mark the median, the middle value when data is sorted, with another distinct line or point. Ensure the chart clearly shows the difference between the mean and median positions to illustrate data distribution characteristics.
The prompt above was compiled from the original drawing commands and is for reference only.