
Visualize Mean and Median by David Wees
Loading the math board and drawing, please wait…
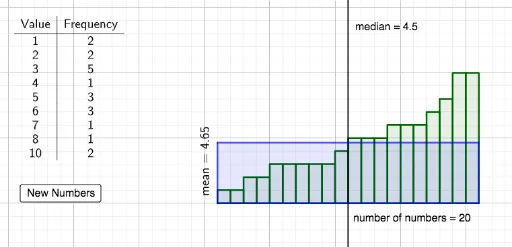
This example uses randomly generated data sets to help students visualize the concepts of mean and median. It involves arithmetic mean and median. Using GeoGebra commands such as FrequencyTable, mean, and Median, the frequency table, mean, and median of the data set are constructed. Suitable for students in middle school and above learning statistics.
GeoGebra Commands & Parameters
FrequencyTable(Numbers) → text1Unique(Numbers) → Listmean(Numbers) → MeanPolygon(A, C, D, B) → q1, a_1, c, d, bSequence(Polygon[{(n, 0), (n + 1, 0), (n + 1, Numbers(n)), (n, Numbers(n))}], n, 1, Length[Numbers]) → L_1Median(Numbers) → MedianNumbersRotateText("mean = " + Mean, 90°) → text2