
Visual Sequence Generator Based on Quadratic Functions
Loading the math board and drawing, please wait…
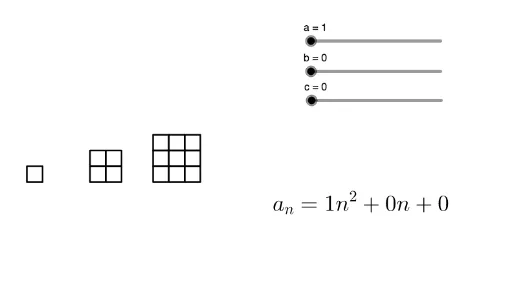
This GeoGebra activity demonstrates how to generate dynamic visual patterns from quadratic functions. Users can adjust coefficients a, b, and c of the quadratic function y=ax²+bx+c to observe how the parabola changes and create corresponding sequence visualizations. Key mathematical concepts include parabola characteristics, sequence generation rules, and the relationship between function roots and coefficients. Construction highlights: Using the Sequence command to generate ordered sequences, applying L_1, L_2, L_3 list objects for visual rendering, and incorporating text1 labels to display parameter information. Ideal for secondary school mathematics teaching on functions and sequences, useful for demonstrating quadratic function transformations and exploring relationships between function zeros and coefficients.
GeoGebra Commands & Parameters
Sequence(Sequence[Sequence[Polygon[((4 * i) + m, (-n) + 1), ((4 * i) + m, (-n) + 2), 4], n, 1, b], m, 1, i], i, 1, 3) → L_1Sequence(Sequence[Sequence[Polygon[((4 * i) + m, n), ((4 * i) + m, n + 1), 4], n, 1, (i * a)], m, 1, i], i, 1, 3) → L_2Sequence(Sequence[Polygon[((5 * i) + 1, m - b), ((5 * i) + 1, m - b + 1), 4], m, 1, c], i, 1, 3) → L_3
AI Drawing Prompt Reference
Create a dynamic visual pattern generator based on quadratic functions. Adjust coefficients a, b, and c to show how the parabola changes and generate corresponding sequence visualizations. Use square polygons arranged in sequences at three levels, each representing different parameter influences, to demonstrate parabola characteristics, sequence generation rules, and the relationship between function zeros and coefficients.
The prompt above was compiled from the original drawing commands and is for reference only.