
Venn Diagram and Probability Statistics Construction
Loading the math board and drawing, please wait…
In collections
Statistics and Probability with Mr Downes
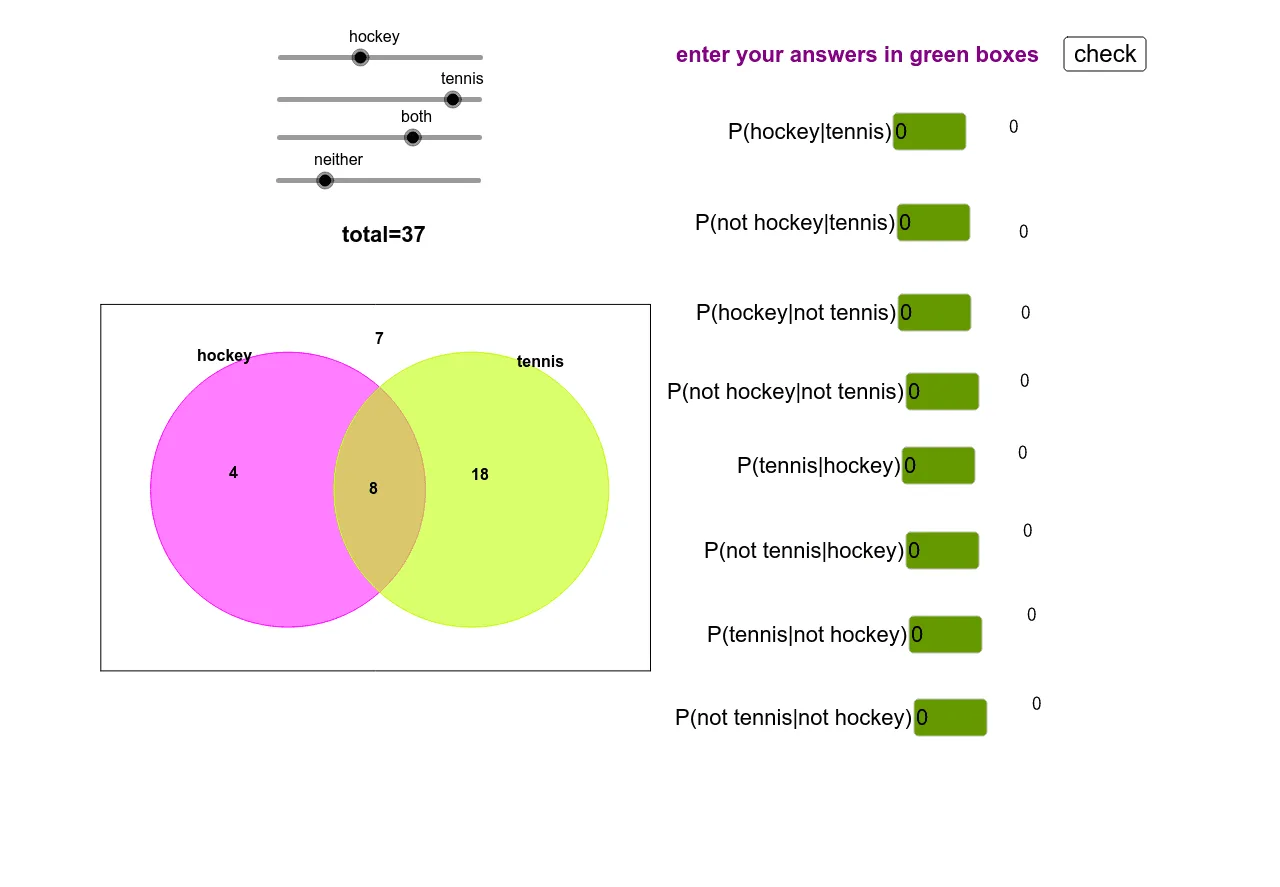
This example demonstrates the construction of Venn diagrams to illustrate probability set intersections and unions, involving concepts like set theory, probability distributions, and geometric shapes. The construction uses GeoGebra commands such as Polygon, Point, Segment, and Circle, along with FractionText and Textfield for labeling. Suitable for high school students or college students to understand set operations in probability statistics and visualization techniques.
GeoGebra Commands & Parameters
Polygon(B, C, D, A) → poly1, b, c, d, aPoint(xAxis) → ESegment(F, G) → eCircle(E, e) → fPoint(xAxis) → H_1Circle(H_1, e) → gFractionText(question1) → fraction1Textfield(question2) → inputBox2FractionText(question2) → fraction2Textfield(question1) → inputBox1Textfield(question3) → inputBox3Textfield(question4) → inputBox4Textfield(question5) → inputBox5Textfield(question7) → inputBox7Textfield(question6) → inputBox6Textfield(question8) → inputBox8FractionText(question3) → fraction3FractionText(question4) → fraction4FractionText(question5) → fraction5FractionText(question6) → fraction6FractionText(question7) → fraction7FractionText(question8) → fraction8
AI Drawing Prompt Reference
Draw a Venn diagram with two circles representing sets A and B, and their intersection and union. Add fraction labels to show probability distributions. Place points E and H1 on the x-axis as centers for the circles. Draw a polygon to outline the boundaries of sets A and B. Add input boxes and fraction labels for entering and displaying probability values.
The prompt above was compiled from the original drawing commands and is for reference only.