
Venn Diagram Example by Dr Brooks (9)
Loading the math board and drawing, please wait…
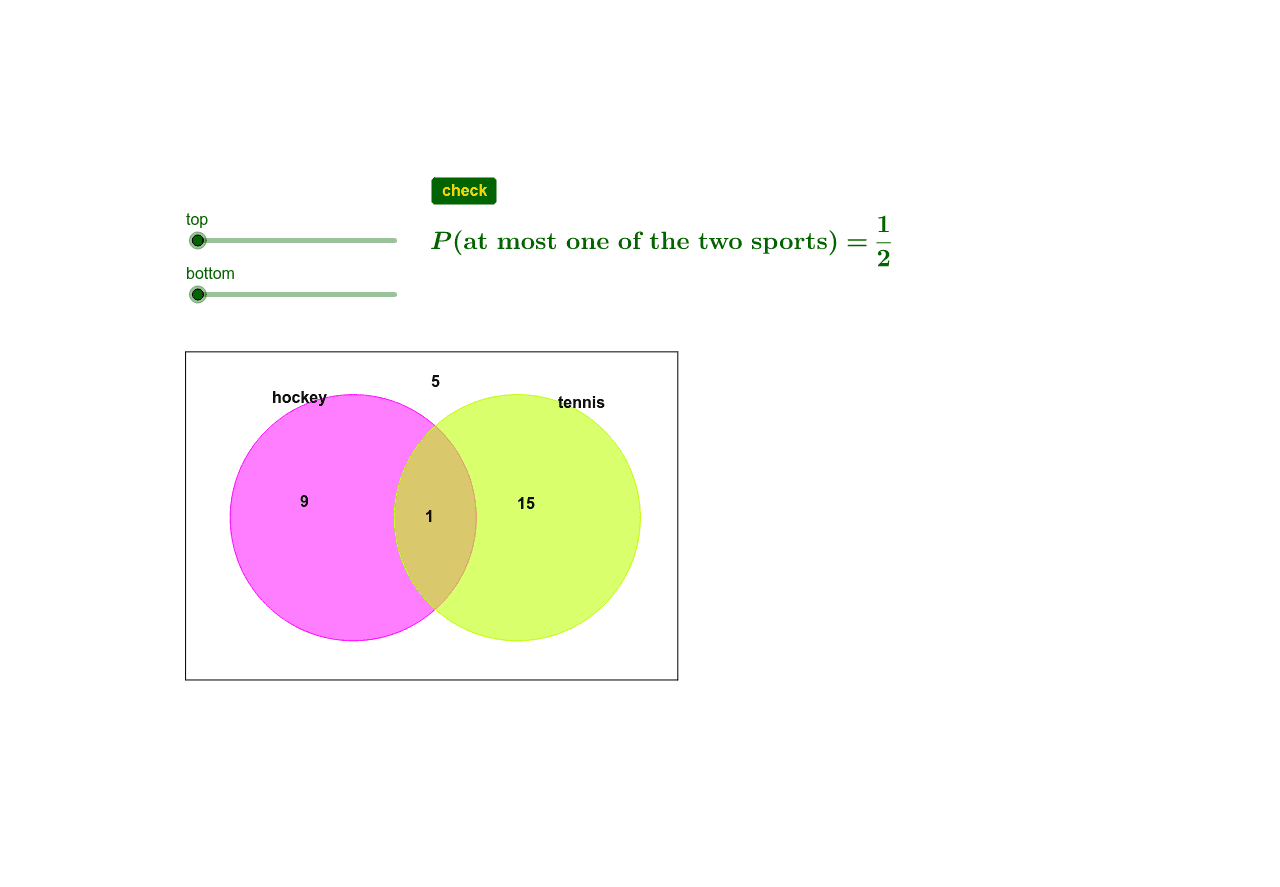
This example demonstrates a Venn diagram, showing the relationships between sets such as intersection, union, and complement. It involves set theory and logic. The construction uses GeoGebra commands like Polygon, Point, Segment, Circle, and If. Suitable for students in middle school and above to learn about set concepts and operations.
GeoGebra Commands & Parameters
Polygon(B, C, D, A) → poly1, b, c, d, aPoint(xAxis) → ESegment(F, G) → eCircle(E, e) → fPoint(xAxis) → H_1Circle(H_1, e) → gIf(GCD[top, bottom] ≟ 1, "", "=" + (FractionText[top / bottom])) → question1
AI Drawing Prompt Reference
Draw a Venn diagram showing the intersection of two circles, including union and complement. First, draw two intersecting circles, then highlight their overlapping area. Connect the outer boundaries of the circles with lines, and label the ratio of the areas of the two circles as a fraction next to the diagram.
The prompt above was compiled from the original drawing commands and is for reference only.