
Venn Diagrams and Set Operations
Loading the math board and drawing, please wait…
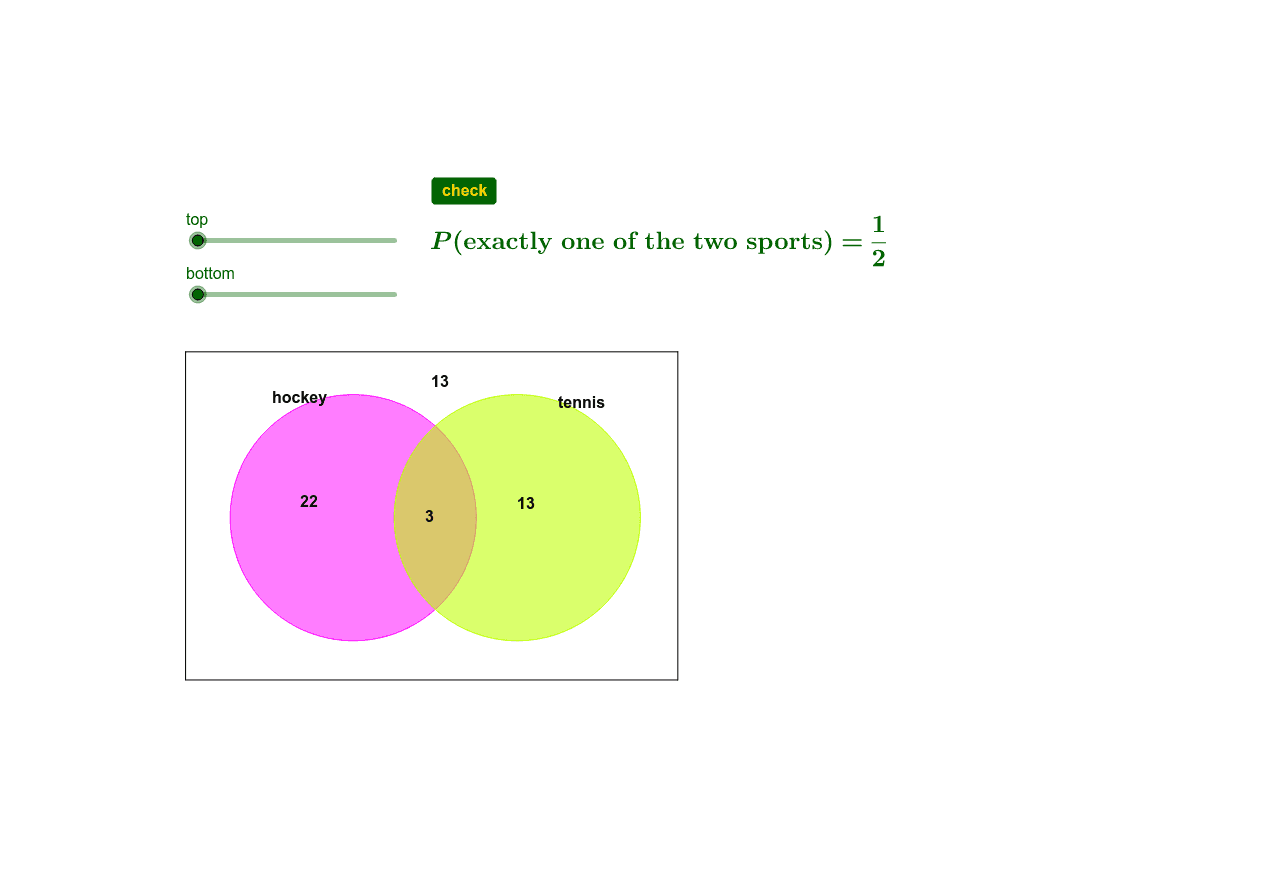
This example demonstrates how to use Venn diagrams to represent intersections, unions, and differences of sets; Core math concepts include set theory, logical operations, and geometric representation of shapes; Construction highlights involve GeoGebra commands/objects like Polygon, Point, Segment, Circle, and If statements; Suitable for high school mathematics or computer science courses teaching set operations and visualization.
GeoGebra Commands & Parameters
Polygon(B, C, D, A) → poly1, b, c, d, aPoint(xAxis) → ESegment(F, G) → eCircle(E, e) → fPoint(xAxis) → H_1Circle(H_1, e) → gIf(GCD[top, bottom] ≟ 1, "", "=" + (FractionText[top / bottom])) → question1
AI Drawing Prompt Reference
Draw a Venn diagram with two intersecting circles to represent intersections, unions, and differences of sets, connect the centers with lines, and annotate a fraction outside to show the ratio, start by drawing two circles, then connect the centers, and finally label the fraction.
The prompt above was compiled from the original drawing commands and is for reference only.