
Self-Intersection Detection for Fourier Polynomial Curves via Polyline Approxima
Loading the math board and drawing, please wait…
In collections
intersection: surface-surface, curve-curve
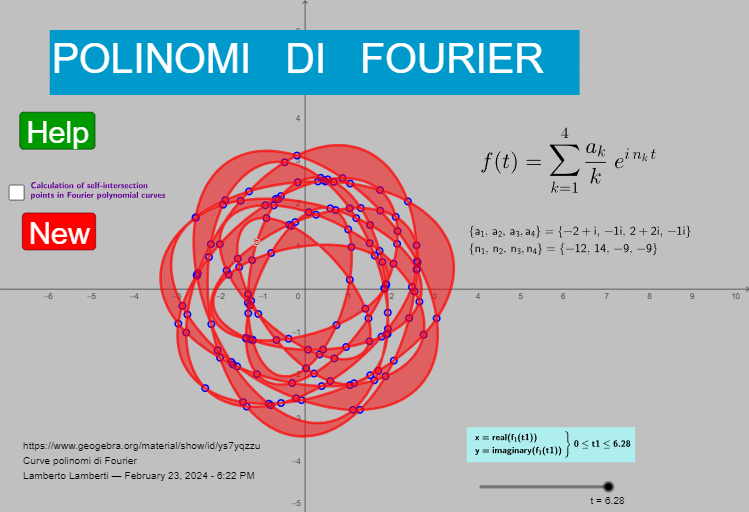
This example demonstrates how to locate self-intersecting points on a planar curve generated from a Fourier-type polynomial (parametric Fourier construction) using a polyline (piecewise linear) approximation. The key phenomenon is that, after discretizing the parameter and connecting consecutive samples into line segments, self-intersections can be detected where different segments cross. It focuses on parameterized curve evaluation, Fourier coefficients/synthesis, discretization with a parameter sequence, and geometric segment–segment intersection logic (secant/chord-like comparisons) to produce and filter candidate intersection points. The GeoGebra construction relies on commands and structures such as CurveCartesian to build the curve, Sequence to generate the sampling parameter t, Element to access corresponding constructed quantities, and utilities like Div, Mod, LaTeX for indexing/formatting. Conditional logic (if, rf, and related parameters such as n0, q_fc, mod_fc) is used to decide which segment pairs are relevant and to filter valid intersection points. Lists like lPoints_y, lPoly_y, and lX_y organize polyline segments and the resulting intersection data for visualization. Suitable for advanced high school, university pre-calculus/engineering math, computational geometry, and graphing-focused learning or projects.
GeoGebra Commands & Parameters
CurveCartesian(rf(t1), if(t1), t1, 0, t) → bLaTeX(b, false, false) → text6Div(f + 1, n0 - 1) → q_fcMod(f + 1, n0 - 1) → mod_fcSequence(PolyLine[m3_0y(k)], k, 1, q_fc + 1) → lPoly_yElement({335, 11, 31, 16, 28, 2, 2024, "February", "Wednesday", 4}, 1) → secondi
AI Drawing Prompt Reference
Draw a planar curve defined by a Fourier-type polynomial parametric equation, spanning a continuous parameter interval. Discretize the parameter into sample points and connect consecutive samples with line segments to form a polyline approximation. Detect intersections between different segments of this polyline, marking each crossing point as a self-intersection of the original curve. Display the polyline path and highlight all detected self-intersection points with distinct markers, showing the curve's self-crossing behavior clearly.
The prompt above was compiled from the original drawing commands and is for reference only.